Dashboard examples: transforming data into action
How to get the full potential of data without dying in the attempt with different examples of dashboards? Making the most of information is a major challenge faced by companies in all sectors. Immediacy, changing trends and market demands mean that decisions have to be made as quickly as possible and in real time. We will explore how customized dashboards turn mountains of data into actionable insights. To do so, we detail examples of very practical dashboards to inspire you on your journey towards process and resource optimization.
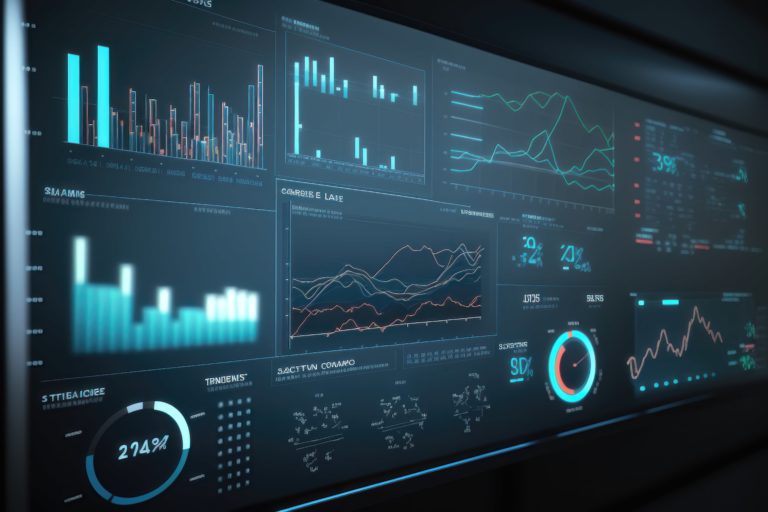
What is a dashboard?
First, the basics. Let’s take a quick look at the definition of what a dashboard is. A dashboard is a tool that visually displays information in real time. The KPIs displayed will depend on the needs of each company:
- Who is going to consume the data
- What will the data be used for
- What is its purpose
- From where it will be consumed
From marketing, sales or financial metrics, the dashboard is a great ally to have clear information at our fingertips. In addition, it offers a cross-sectional and at-a-glance view of everything that is happening and everything that could happen in the business.
Dashboards examples
When we talk about dashboard examples, we have numerous options. So let’s discuss some of the most popular types of dashboards and give you practical examples of each. You’ll see what power data visualization has in a company’s culture.
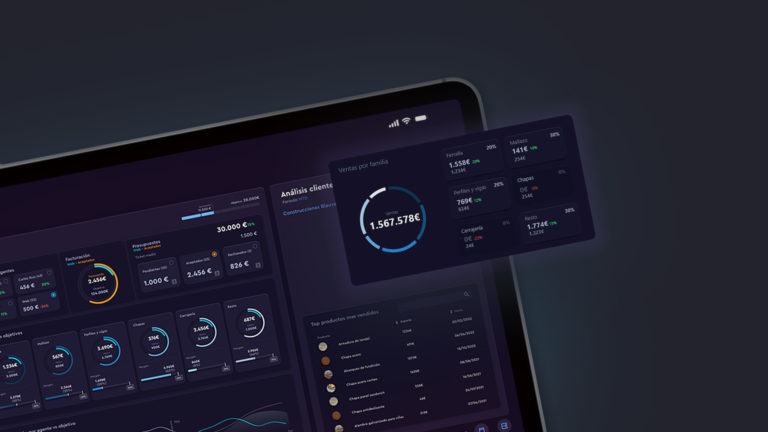
1. Commercial dashboard example
The commercial dashboard or sales dashboard is undoubtedly one of the most popular and requested by companies. Not only because of the importance of having full control over all the commercial activity carried out in the company, but also because visualizing the department’s data gives us clues about the demand for our products or services, future trends and customer needs.
Thanks to the use of graphs and pivot tables, you will quickly detect any opportunity for improvement, any deviation and, therefore, make instant decisions to improve results thanks to the commercial dashboard.
2. Sports dashboard example
Are you aware of the amount of data that a sports club handles? And we are not only referring to those that have to do with athlete metrics as such and with the results of a match or competition. No. We are talking about information related to merchandising and online store, food and beverage sales during matches or social networks. Many sources of information that give us valuable clues about what is happening around each match. The sports dashboard is an invaluable type of dashboard for sports organizations. Not only does it provide information on athlete performance, but it is also a way to manage resources and plan game strategies. A comprehensive view of the club’s performance in all areas: from sporting, financial or commercial. Undoubtedly, the digitalization of the sports sector is the order of the day.
3. Restaurant dashboard example
Another example of a dashboard is the restaurant dashboard. A restaurant generates hundreds of data every day. Data related to suppliers, expenses, stock control, perishable food control, customers, tickets, menus, reservation system…
Keeping an exhaustive control of all this information is crucial to:
- Save costs.
- Optimize time.
- Motivate and involve the staff.
- Make menus adapted to what the customer really wants.
A restaurant’s dashboard is essential for daily management and operations. In the end, the goal is to sell more, maximize occupancy and, above all, make diners happy.
4. Hotel dashboard example
How to make guests feel at home? Data visualization in the hotel industry is a huge challenge. Multiple sources of information, the PMS, booking platforms, social networks… In addition, we add the needs of each of the guests: food intolerances, days of stay, extra services contracted…
If there is no fluidity in communication, if there is no coordination of the team and if we have no control over the data, we are lost. So, how to surprise with personalized experiences and improve the hotel’s day-to-day operational management? The hotel dashboard is a visual solution that not only unifies the information coming from all the information software, but it is also a powerful internal communication tool and a leap towards an intelligent, automated approach with the ability to perform predictive analysis.
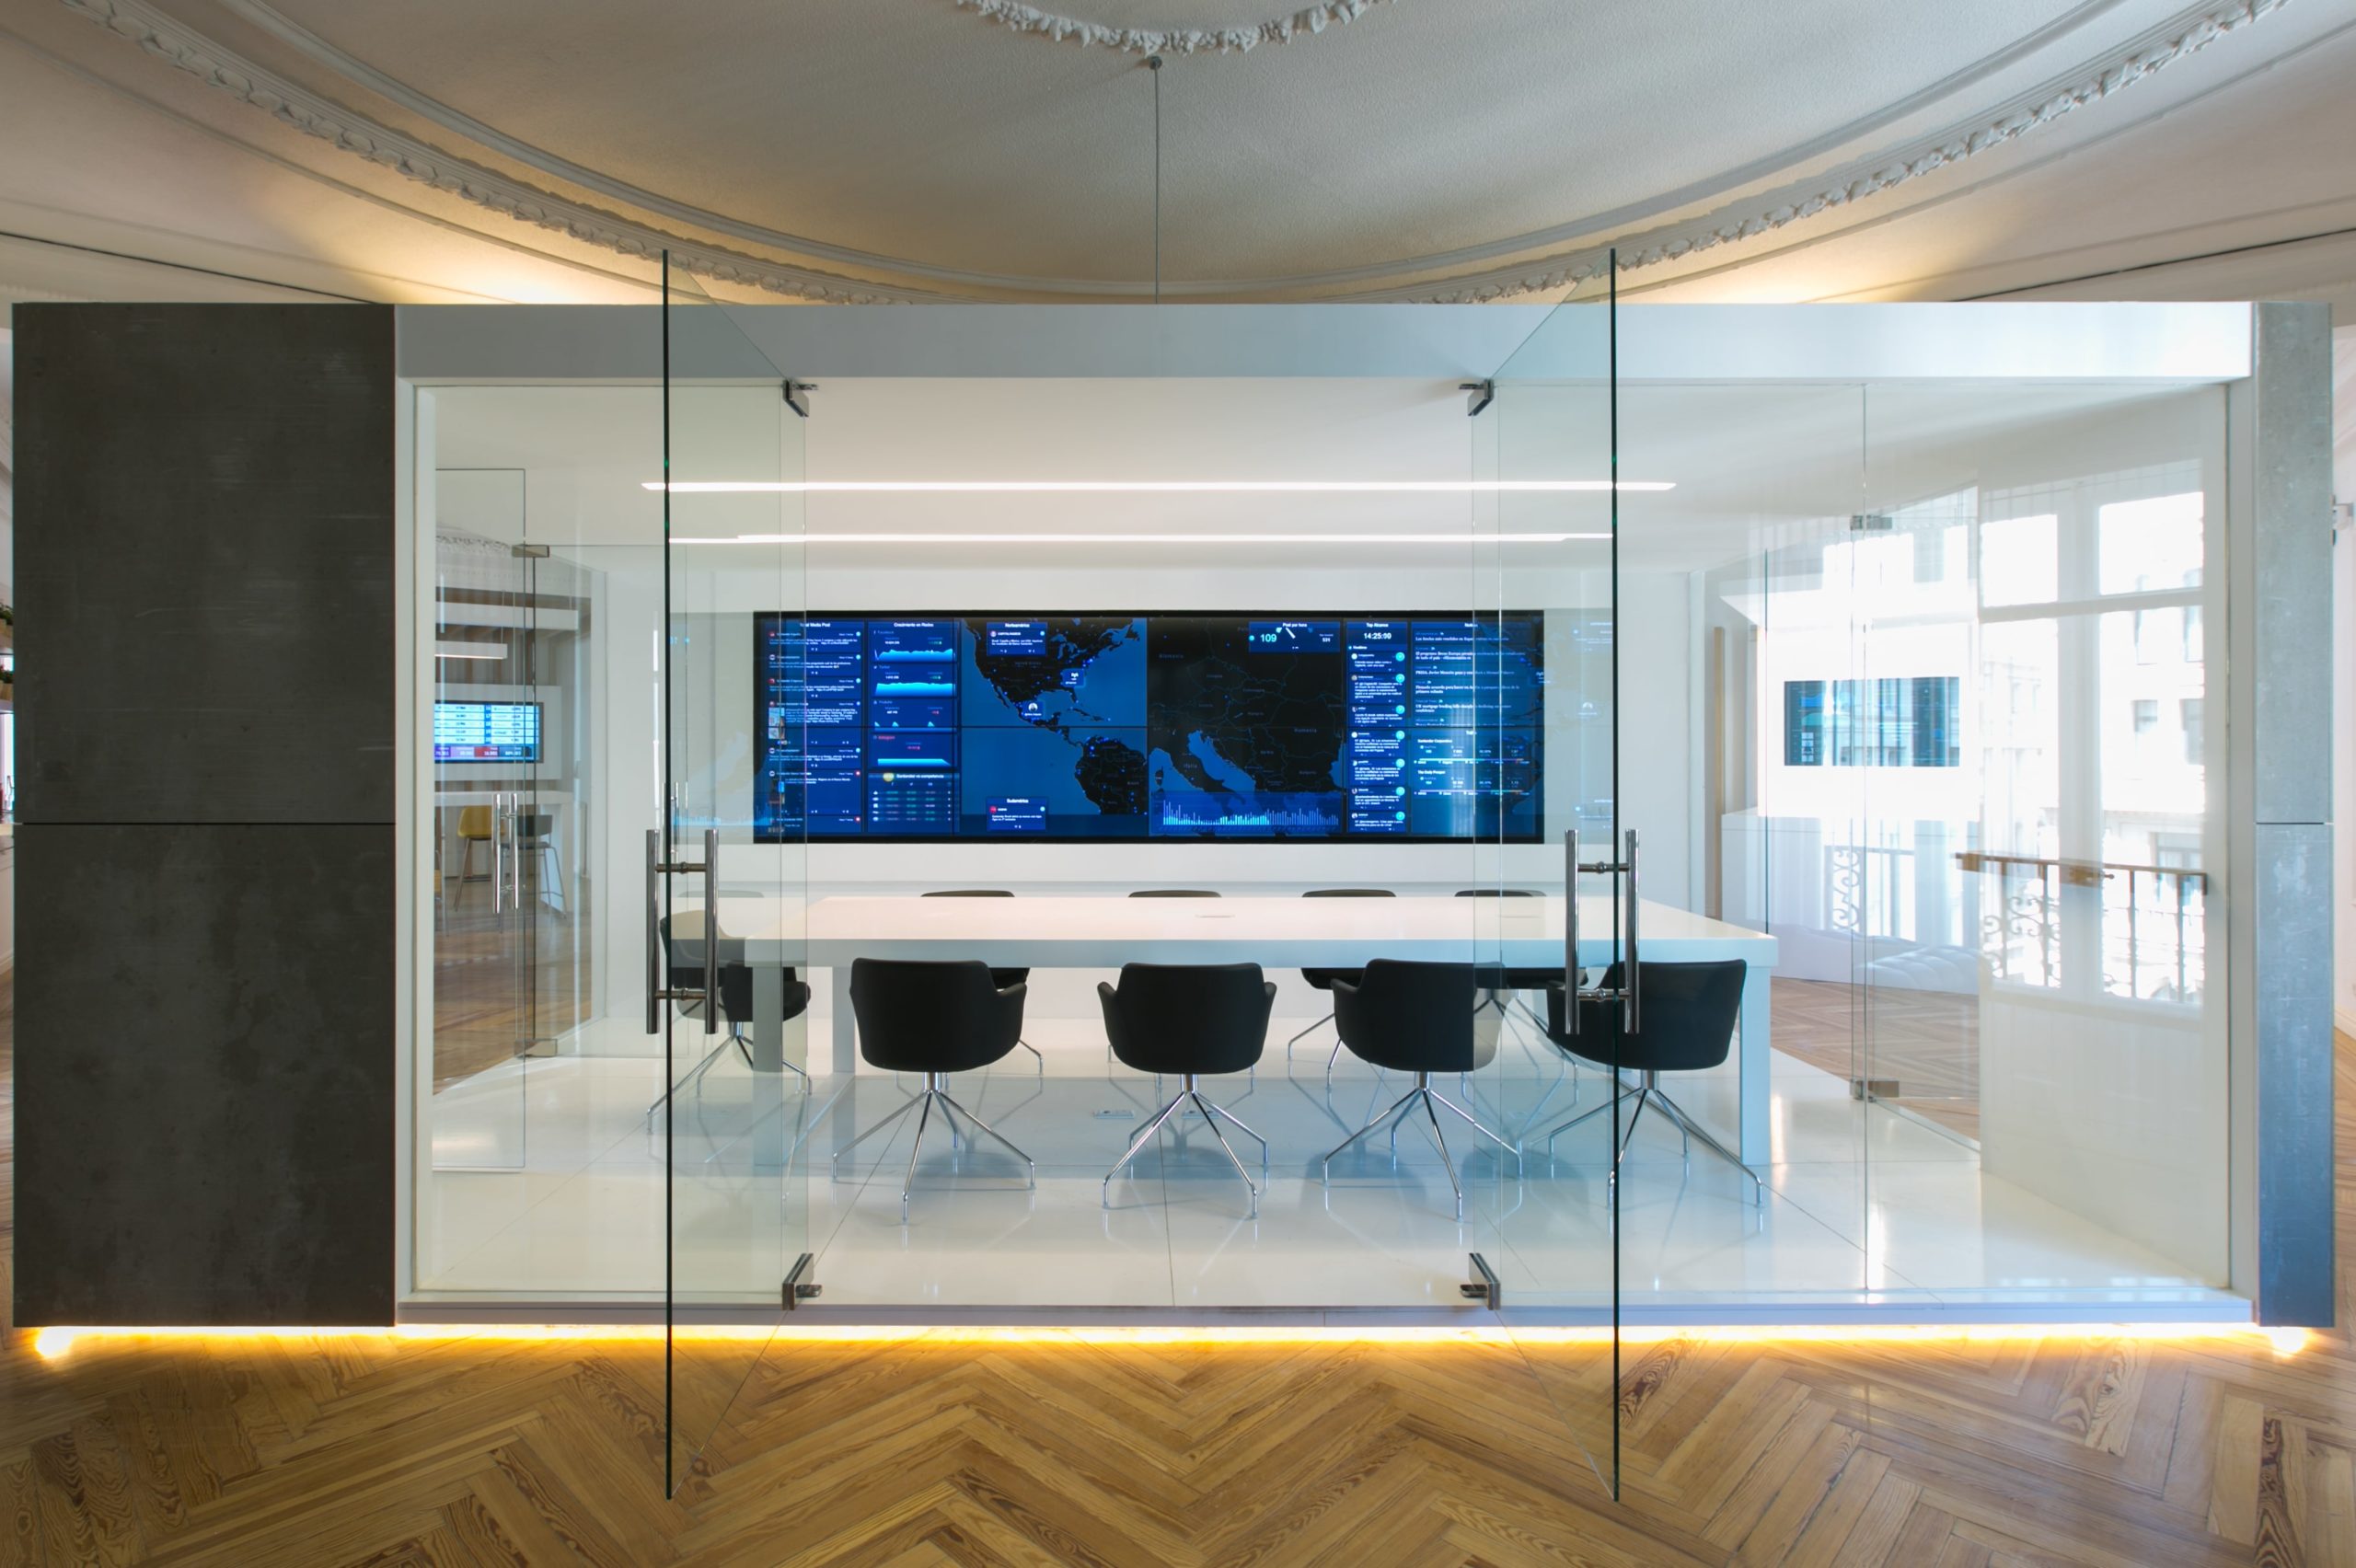
5. Marketing dashboard example
Another example of a very popular dashboard is the marketing dashboard. Data from Google Analytics, advertising campaigns, email marketing campaigns, social networks… In addition, it is information that the manager in question must consult every day from each of the platforms. A lot of time is invested not only in the consultation of information, but also in its dumping, unification, subsequent interpretation and decision making. Digital is now for now. So it is useless to make reports with days of delay. Decisions must be made in real time, trying to anticipate possible scenarios and being as fast as possible. A marketing dashboard will allow us to do just that. Besides, we will be able to track the key KPIs for our company in particular, analyzing key data such as the return on advertising investment or the profile of our customers.
6. Logistics dashboard example
We are all aware of how complex a supply chain can be. There are thousands of parts, processes and material inputs and outputs that we must take into account. In addition to controlling the fleet of trucks and vehicles, workers’ shifts, suppliers, etc. A logistics dashboard is key to achieving an optimal level of operational efficiency and, in turn, reducing costs. From route planning to shipment tracking, this type of dashboard gives you a complete overview of your logistics operations in real time.
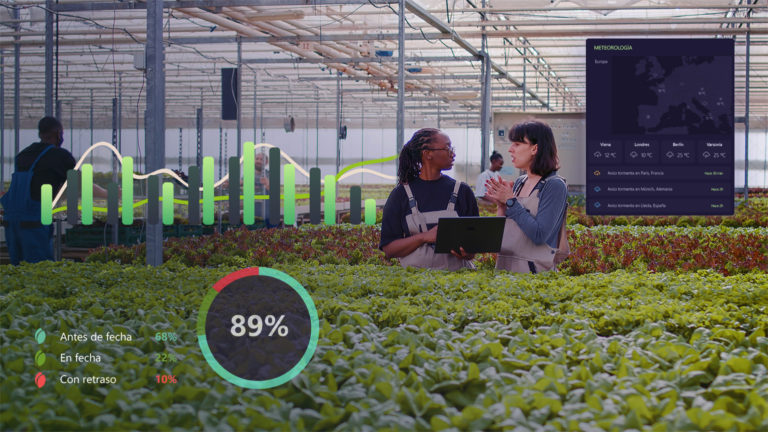
7. Agro dashboard example
Technology plays a key role in agriculture. In a scenario of great uncertainty and dependence on external factors, it is very important to have digital solutions that help to foresee, anticipate and have fewer losses. What does an agro dashboard bring to crops? Having enough capacity and autonomy to make predictive decisions. We do not react late and badly. We know at all times what the weather will be like, what the soil quality is and what factors affect it; what yields the crops are giving us; what the import/export levels are… All this, in addition, will directly affect sales prices. The agro dashboard is a technological support that helps maximize crop yields and improve crop quality.
Examples of dashboards from all industries
In short, there are many examples of dashboards that have applications in many industries. The dashboard helps to empower teams through data, to make better and more agile decisions and, ultimately, contributes to the improvement of day-to-day operations. A personalized dashboard is the ally of decision makers in companies and is a further step in the journey towards digitization and data visualization.