The use of data as a cultural change in the company
Visualisation and monitoring alone are not enough to bring about a cultural transformation in companies; it needs to go one step further: use data to achieve that change and above all take advantage of the benefits of digitization to get reactions from the teams.
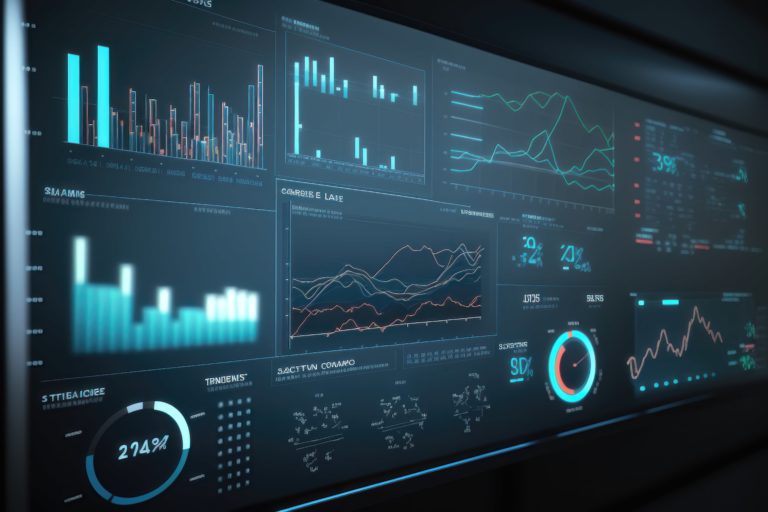
It is true that a well-crafted dashboard can help optimize management and reduce analysis times, but that is not enough to achieve real change through data; to create reactions through data. A dashboard can be visually very attractive but it is useless if it does not lead to action; hence the importance of managing to conceptualise dashboards aimed at generating emotions, motivating teams and provoking conversations focused on making decisions.
Empowering teams by sharing data
Taking advantage of digitisation to get feedback from teams. But the question is: What is the first step I must take to achieve this change in my company?
First thing is to know if we have the data and how we have it; secondly, who the dashboard is aimed at; and finally, in what format we are going to consume it.
1. Where and how we have the data
In a Data Warehouse, Data Lake or without grouping in different sources of information that we use. We have it in real time or in which period it is updated.
At this stage, data should be worked on at its best, but it is not a determining factor either; being able to have part of the data to be consumed at the lowest possible frequency is. In addition to being able to locate, among the immense amount of information we have, the data that is really key to decision making. Since the key is not only to offer information in real time, but also to be able to mobilise and excite an entire team.
2. Who the dashboard is for
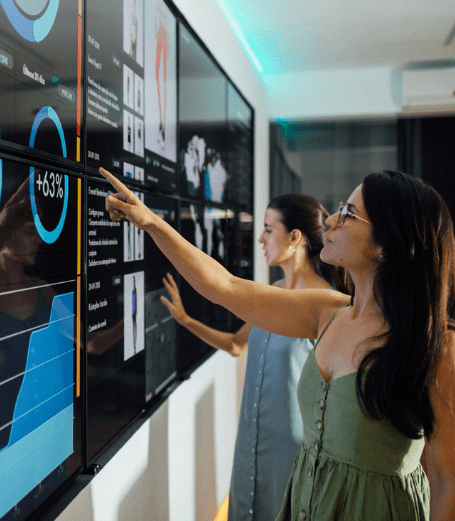
By democratising the data we empower teams, and this must be headed to the motivation of the teams, to get a reaction. That is why it is key to define those necessary indicators for each team, department, that can lead to action. A dashboard that will be consumed by management is not the same as one that will be in the plant or aimed at employees. Each one must have the ideal conceptualisation to motivate teams and provoke conversations focused on making decisions.
All this through a useful design, an ad hoc conceptualization for each of the panels. Studying in detail the types of graphics, the colours, or what is the best way to distribute the information within the panel to create visual patterns that speed up the analysis.
Exploring also the psychological part of receiving information.
3. In what format
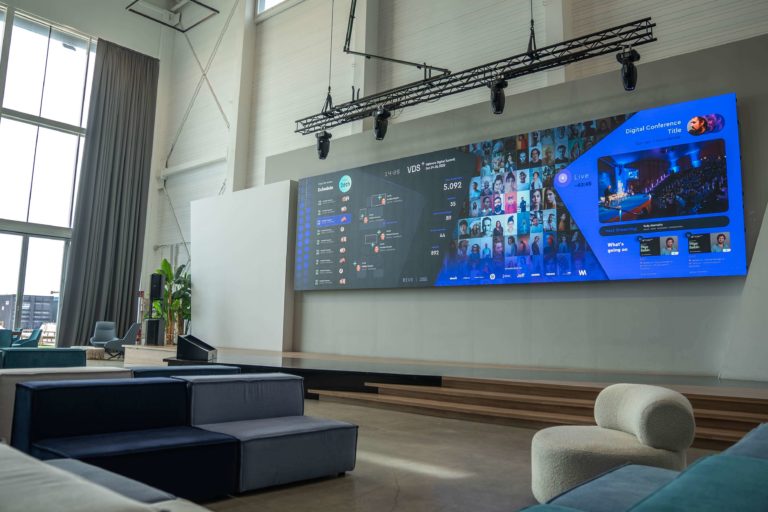
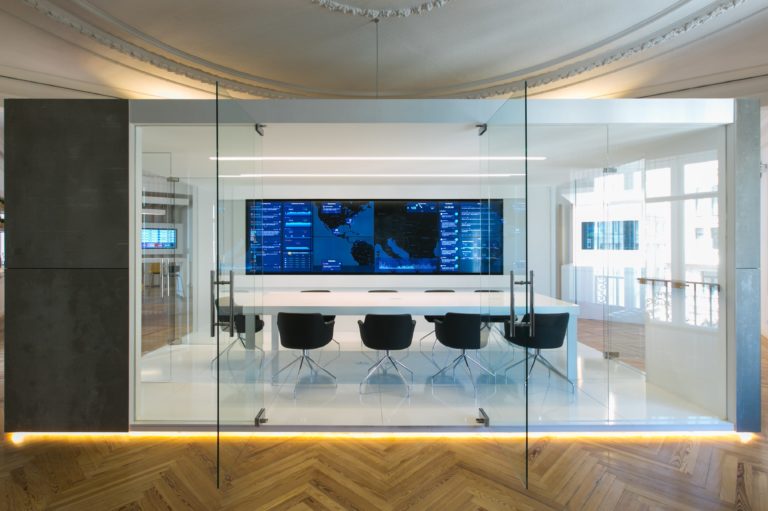
Finally, we have to define the format in which we are going to transmit the data. Through a video wall because part of the team is in offices where it will play a fundamental role; desktop because it is more of a work tool; mobile because teams are always moving around or even by vocal message.
Data has to go with us wherever we go, which is known as “flowing data”. We also have a commitment to be “On Alert” and not the traditional “on demand”. You don’t have to access it to visualise the information, but the information comes to us. Every time something happens, it warns us, either through push messages on the mobile or an alert on the screen.
From data to action: creating reactions
The cultural transformation of companies through data begins with their democratisation.
Sharing information empowers teams and speeds up the analysis of the information, betting on the most human aspect of the data. All this under a storytelling, telling a story, understandable by all workers in the company.
Hence, to reach this stage, traditional BIs are not enough. These softwares are focused on managing data, aggregating and exploiting it, but they do not have the key inspirational layer to reach this transformation and to empower teams.
This is the basis of Smart Visual Data, a customised solution for each company aimed at getting feedback from people through data.