Digitization of the education sector

We live in an era marked by technology, where innovation is a must for the growth of any company or organization. In this context, the education sector is no exception. The digitization of the education sector is a process that has been going on for years and, thanks to this, they have been able to collect more and more data related to their business. Not surprisingly, although it is still taking its first steps, there are many experts who predict that Big Data will bring about a real revolution in the field of education. However, this new paradigm poses, in turn, a challenge for all of them: What to do with all this information, how to analyze and cross-check data on leads, social networks, enrollments, students, management platforms?
The answer lies in Big Data, in the set of technologies and practices that make it possible to store, process and analyze large amounts of data. If we manage to interpret the data, we will make better decisions, be more efficient and be able to offer a better product or service.
How can we apply all this to a university?
Currently, one of the phenomena that is affecting data analysts the most is omni-channeling, which makes it difficult to unify information. Universities receive potential leads from social networks, mailings, websites and even trade shows. Putting all this information together can take time that could be invested in other tasks.
Recently, we had the opportunity to work with EDEM, a business school oriented to train students, entrepreneurs and businessmen, in the development of their mobile tool. The experience of working with their team has been a luxury from which we have been able to learn the importance of the digitization of the education sector and the added value that our solution brings. They themselves told us:
“We work with a lot of sales data, from openings to closing deals, from leads to students. This information generated two problems for us: outdated data in Excel spreadsheets and many people asking for the same information.”
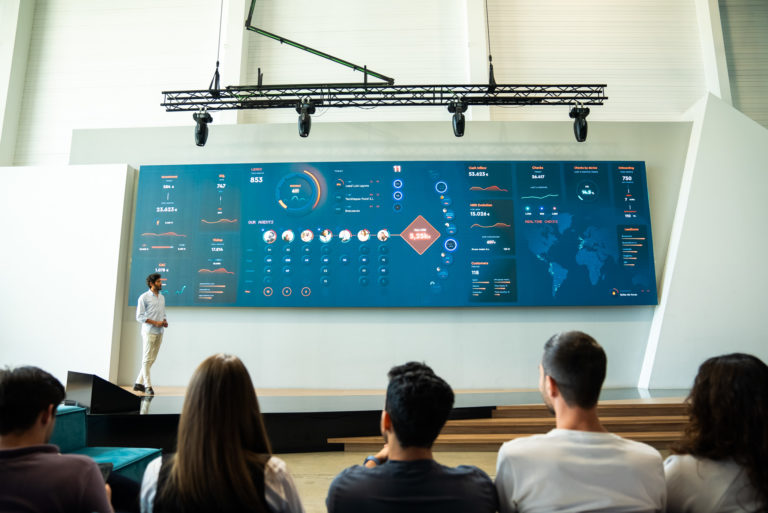
In this example we can clearly see the importance of a correct data visualization. We can have all the data from all sources, but if we look for them and try to be scattered, and at the end you can not communicate at all, nothing serves to have this information. The data must be actionable, it must be communicated to provoke an action, it must generate a consequence.

In a single dashboard we can get a clear view of the sales FUNNEL. From the attraction of potential students to the conversion at the moment of enrollment. Through graphs, at a glance, we visualize those courses in which we are losing opportunities to convert or, on the contrary, those that have high conversion rates.
Data visualization
The data visualization in a panel with graphs, bars, colors, offers endless possibilities. We can know how the general performance of the institution is going, as well as the data of each course or master’s degree, class and even of the students. To know at what point students begin to drop out of courses, to study whether the study plan is correct, to observe which days there are the most absences, to know what difficulties they are facing and at what precise moment. We want to help prevent before the reaction is forced. The massive analysis of information allows us to make diagnoses in real time, so it is an important tool to detect cases of alert or reasons for attention and to act before the problem arrives.
But we can also talk about developments aimed at teachers and students. Thus, for example, we have developed mobile applications for the sales representatives of companies such as Grupo Pamesa or Embutidos Martínez. An example that could be perfectly replicable to an educational institution.

Via mobile app, we can send alerts to both teachers and students. Push notifications, programs or punctual, that notify about class reminders, incidents such as cancellations of a subject or last minute changes in the teaching of classes.
We seek, quite simply, to put data and technology to work for the benefit of people. Data alone is nothing, but that same data analyzed in depth becomes a treasure trove of reliable information that, in the quest to digitize the education sector, can make a difference and help institutions make the best decisions.