This website uses cookies so that we can provide you with the best user experience possible. Cookie information is stored in your browser and performs functions such as recognising you when you return to our website and helping our team to understand which sections of the website you find most interesting and useful.
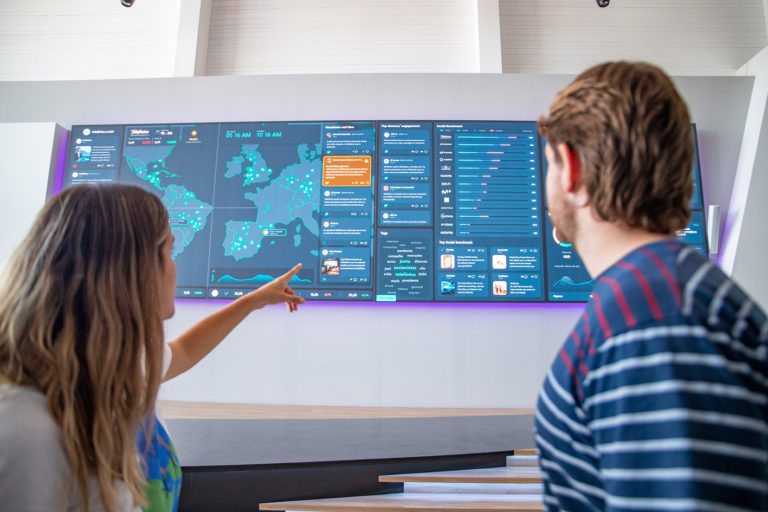
Difficulty in managing information when it comes from different sources, leading to confusion and delays in decision-making.
Complexity in coordinating and managing campaigns across multiple channels, leading to inefficiencies and resulting in lost opportunities and resources.
In a highly competitive market, differentiation is key to capturing the attention of our target audience. Having the data and understanding it gives us a strong advantage over the competition.
A lack of ability to spot new trends can lead to missed opportunities and a lack of understanding of our potential customer.
 ZEUS solution
 By centralizing data on a single platform, we achieve a clearer and faster overview for better informed decision making.
Monitoring the performance of each campaign in real time makes it easier to identify the most effective channels and optimise the budget invested.
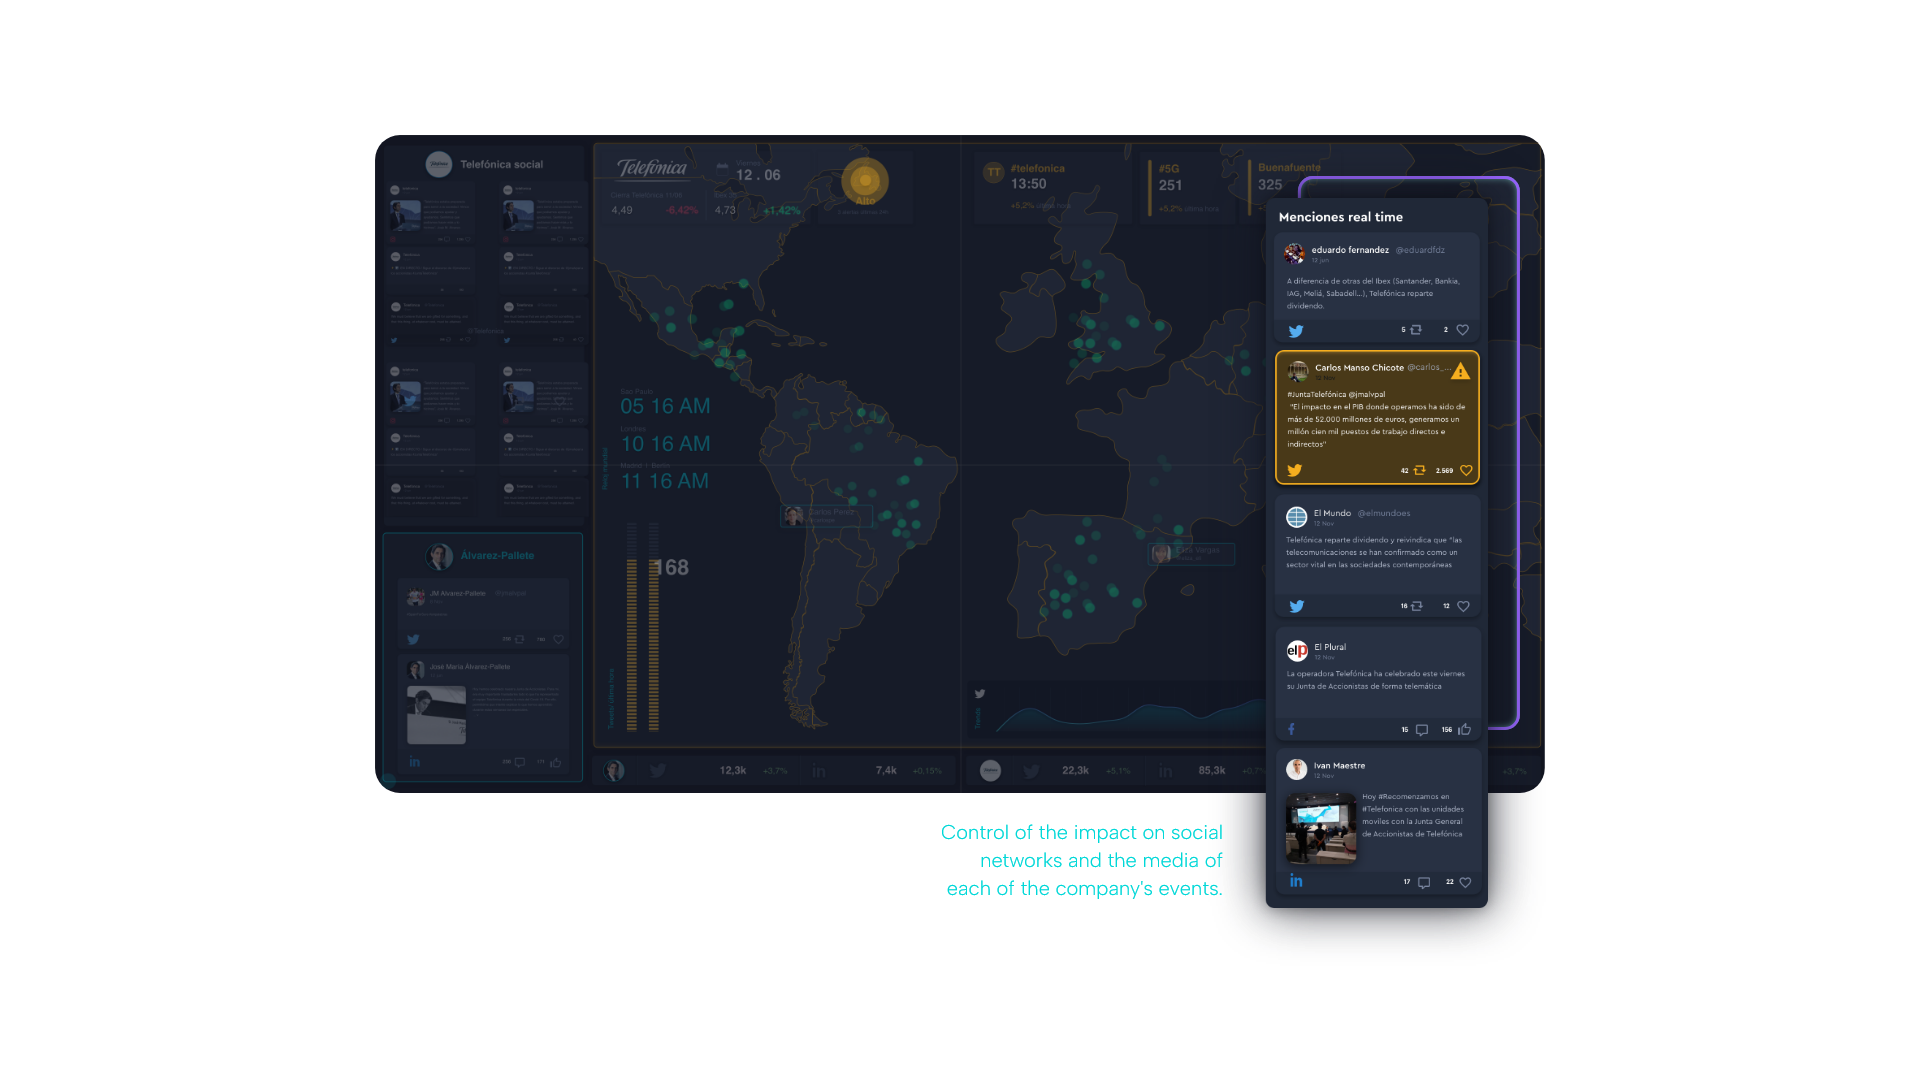
By understanding what resonates and stands out on each social network, we can adjust our marketing efforts while staying relevant to our audience.
Being alert to changes in consumer behaviour and market innovations allows us to adjust our strategies before they become the norm.
Visible data, agile decision-making
Data at the heart of every decision
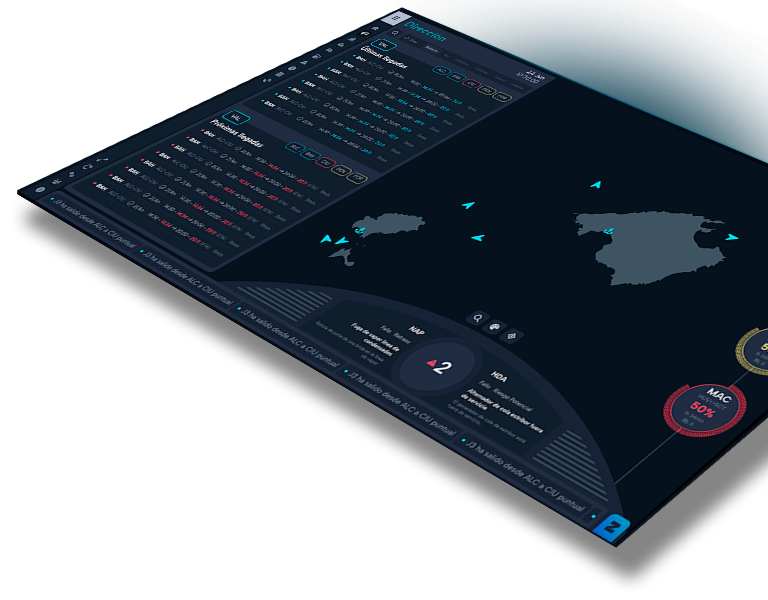

Command Center for the total control of the fleet of ships of the maritime logistics company Baleària.
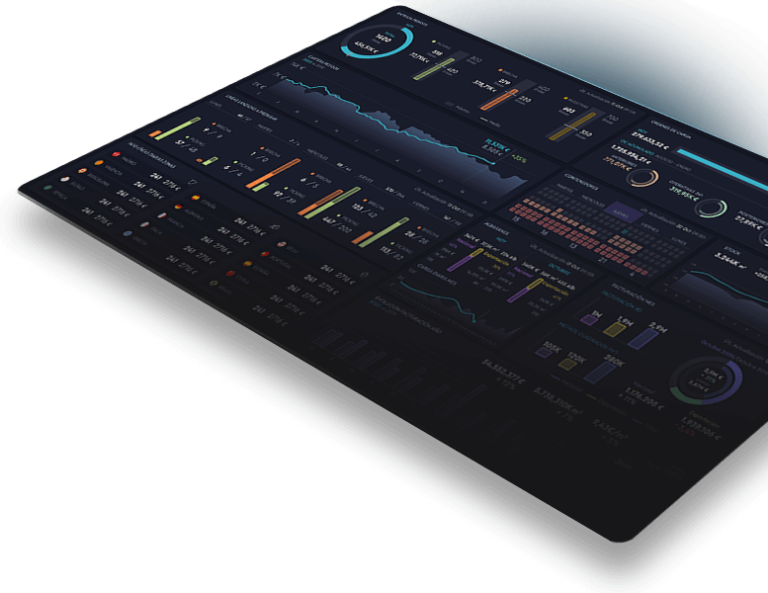
Fleet Control Tower using artificial intelligence and big data tools.
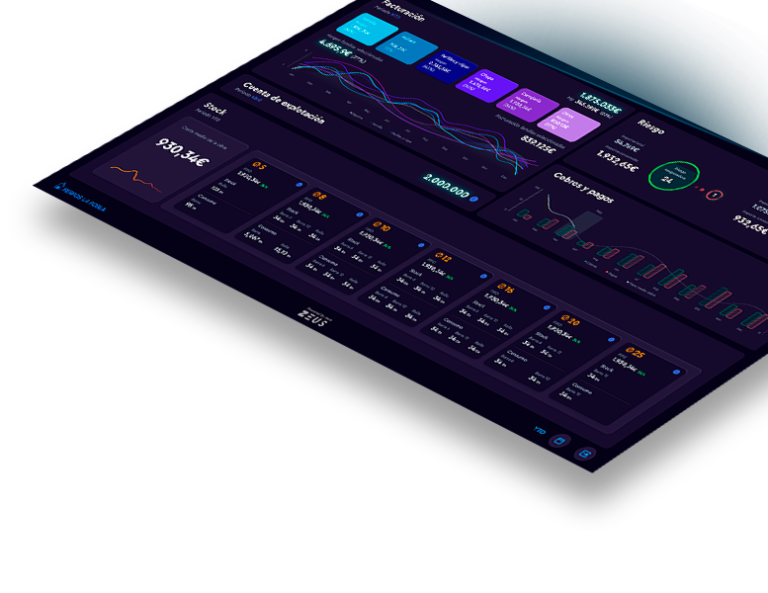

Development of a 6-view videowall to improve customer and supplier relations.
Monitoring of all customer activity through a videowall with real-time data.
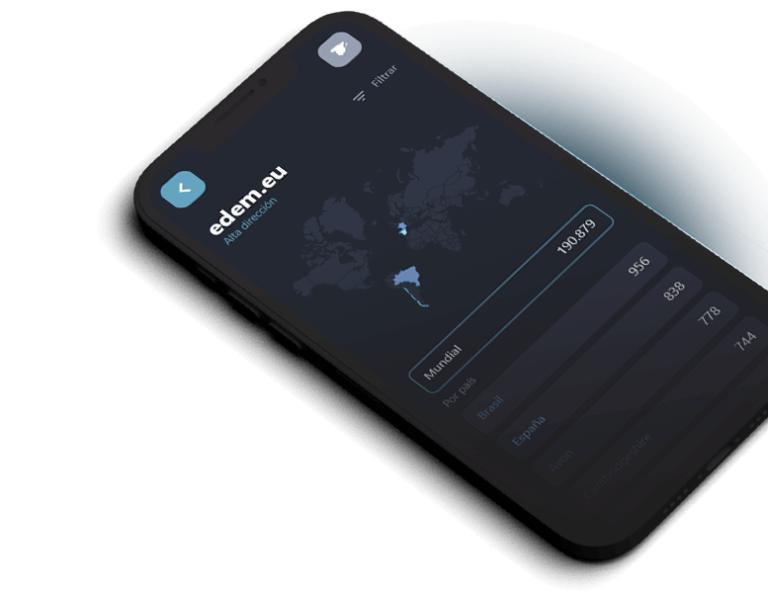
Development of a mobile dashboard for marketing and sales teams to make better decisions.
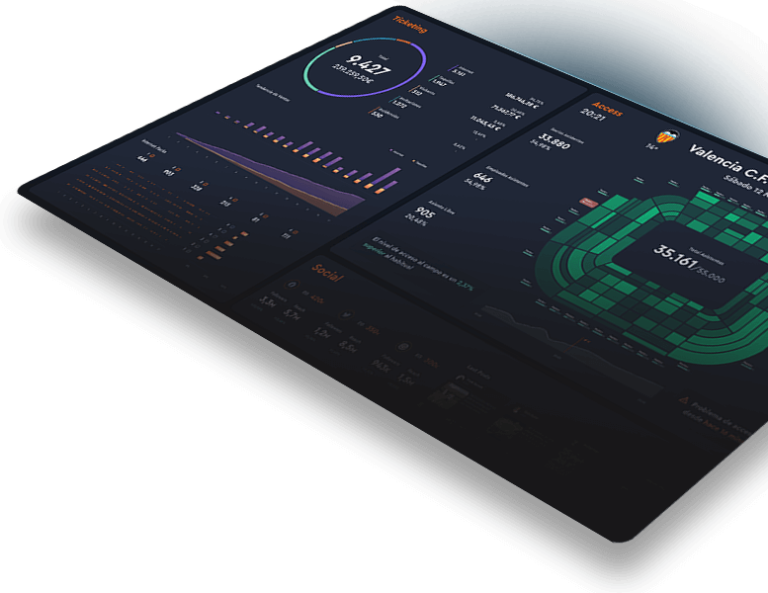
Valencia CF had scattered information to consult in different sources, wasting a lot of time analyzing and interpreting it. Through the videowall they have the data centralized and updated in real time.
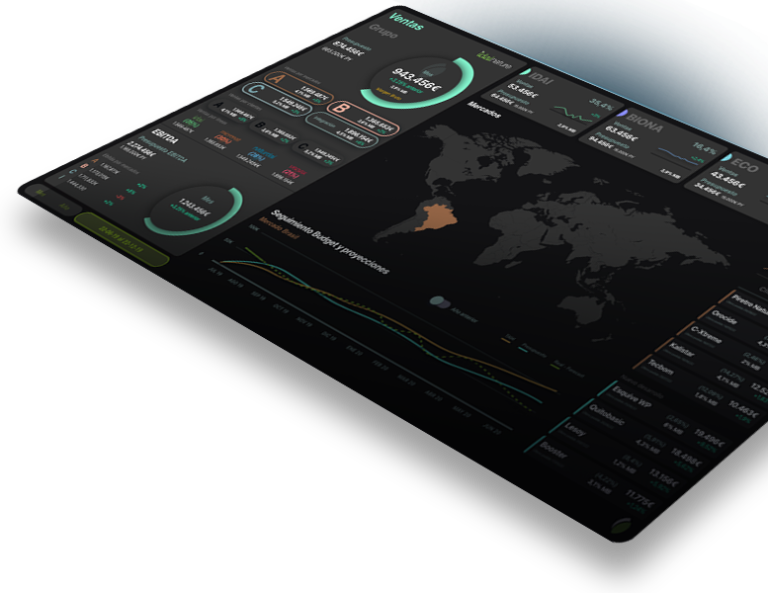
A project with 5 dashboards to give managers a transversal view of the company.
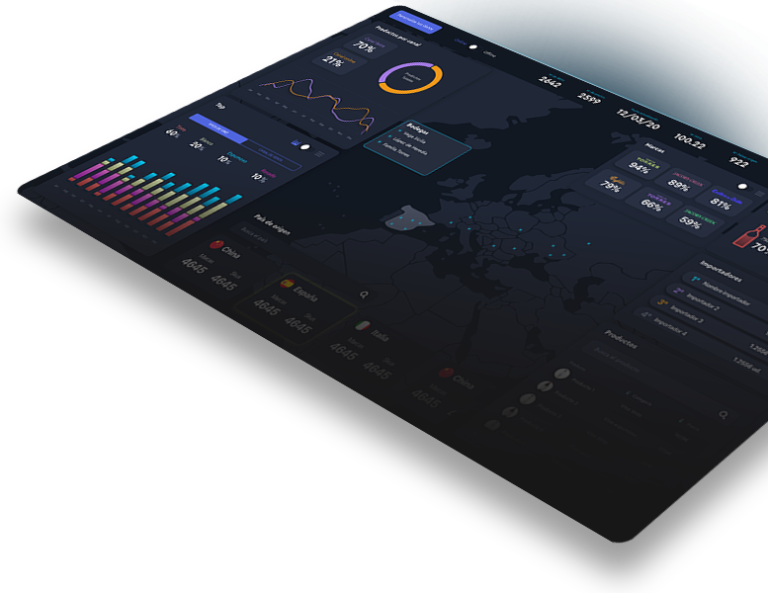
Business dashboard for companies exporting products to have a real-time analysis of the state of trade and the main KPIs.
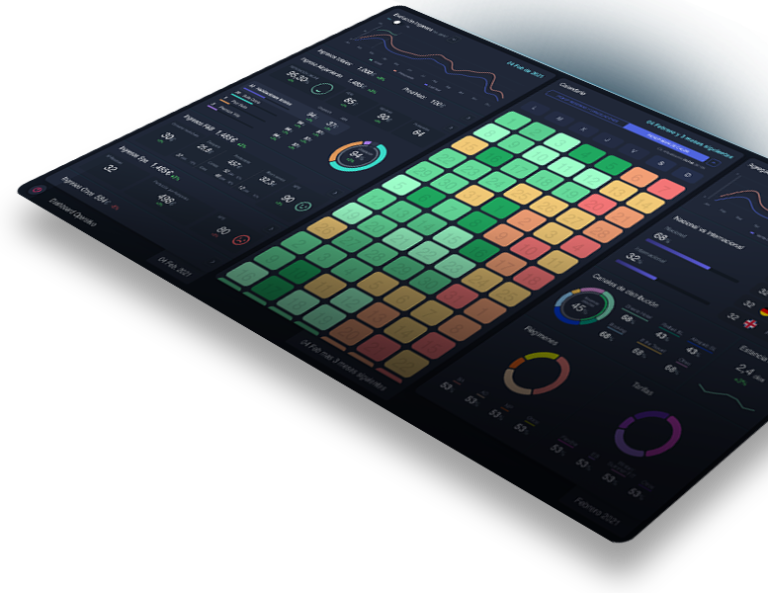
Operational and customer dashboard to optimize decision making and improve customer experience.
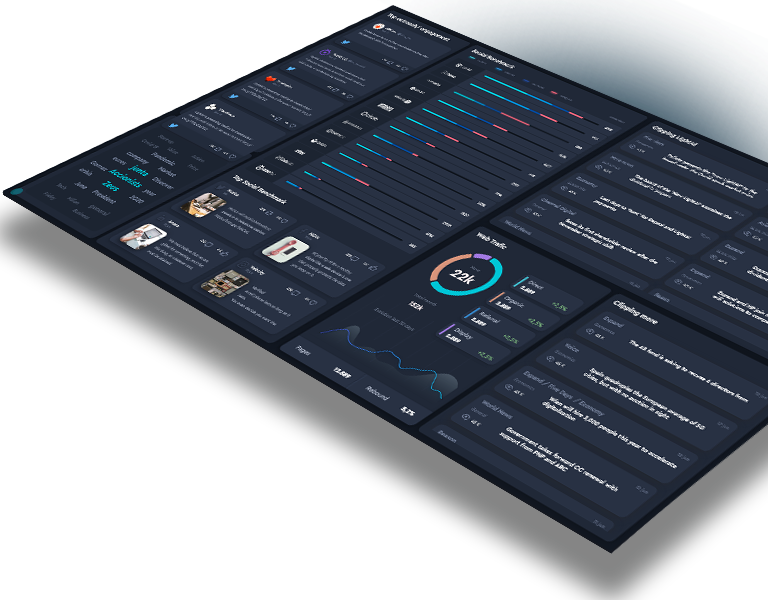
Social Dashboard that integrates all business metrics. Monitoring objectives accompanied by key general information.
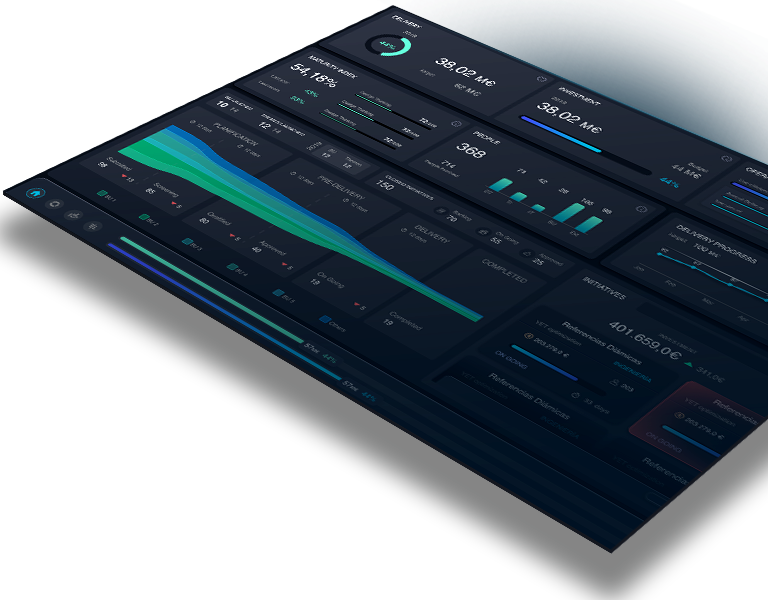
Possibility to choose a business unit through a pull down menu or a filter and the widgets are recalculated according to the data of each unit.
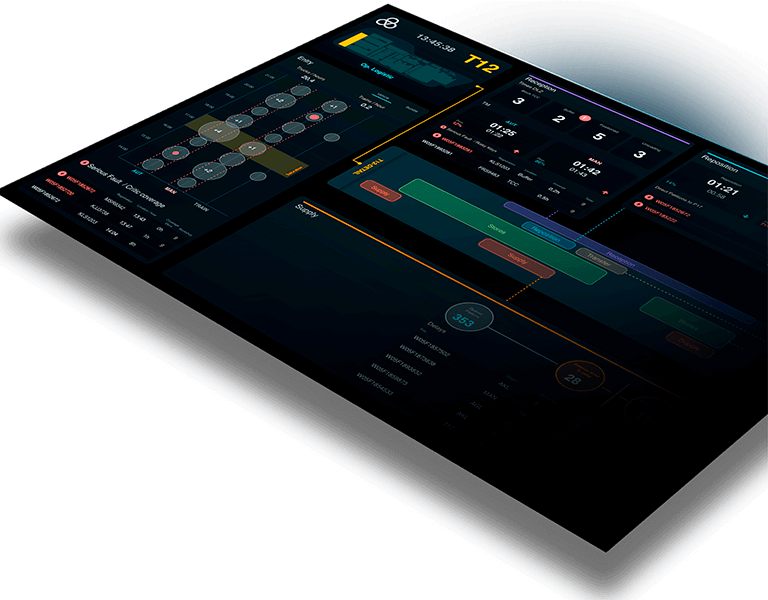
An information surveillance system for the entire supply chain
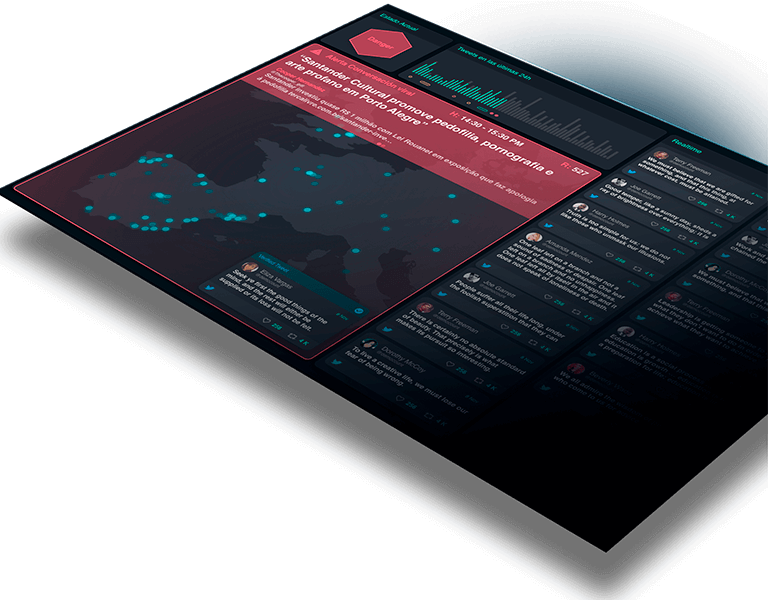
One of the most complete video walls on the market, which integrates more than 12 sources of information.
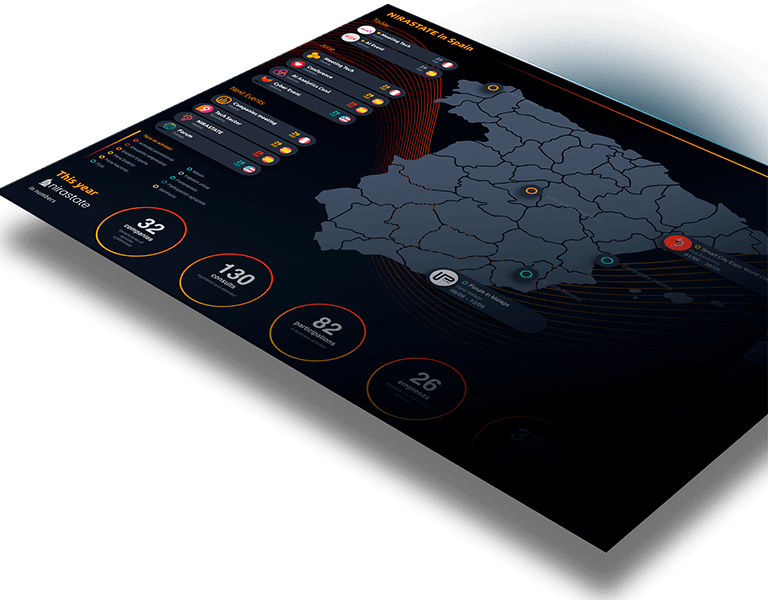
Need to make visible all the communication and business activity
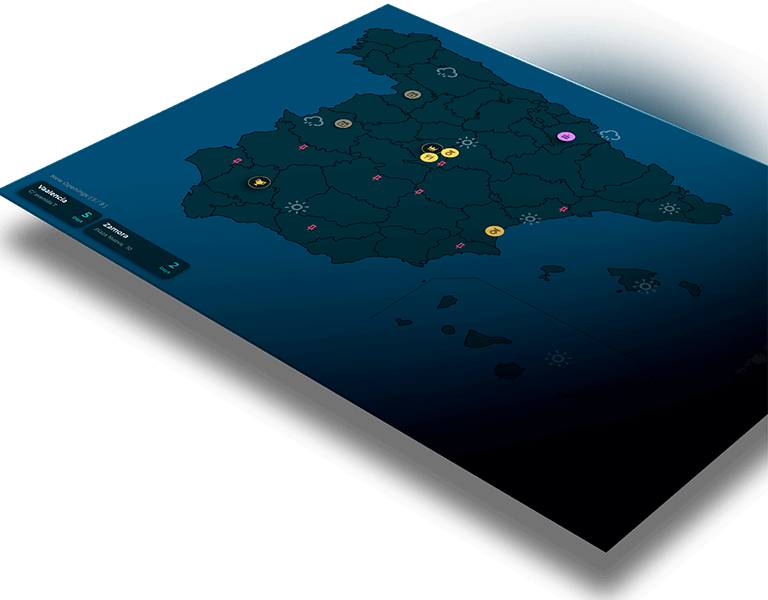
Complete Smart Visual data project for restaurant and equipment management
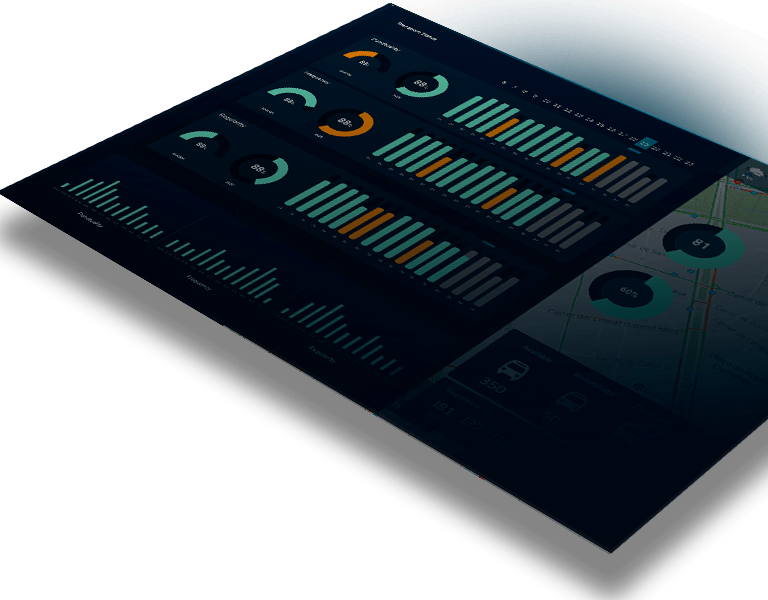
Dashboard that monitors the Traffic Regulation Center of the EMT Operations to work in a more effective and efficient way.
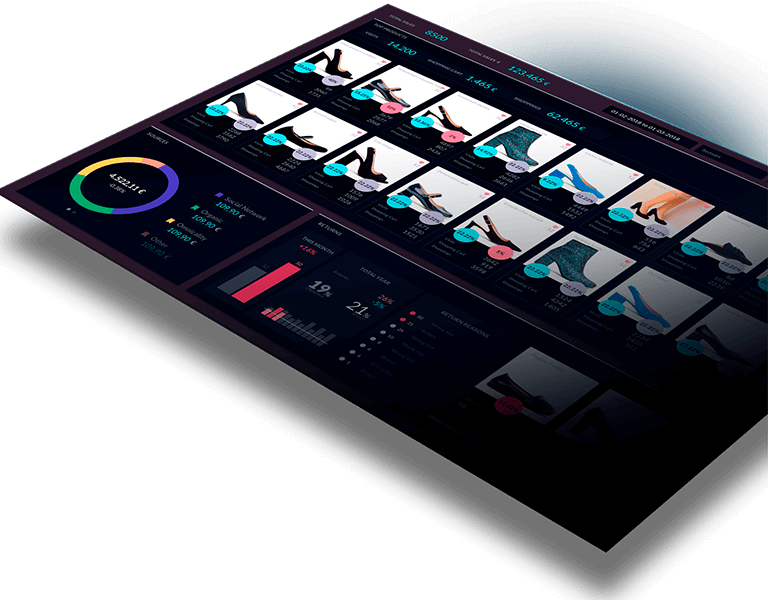
Sales analysis, product comparison, efficiency of advertising campaigns. All in real time
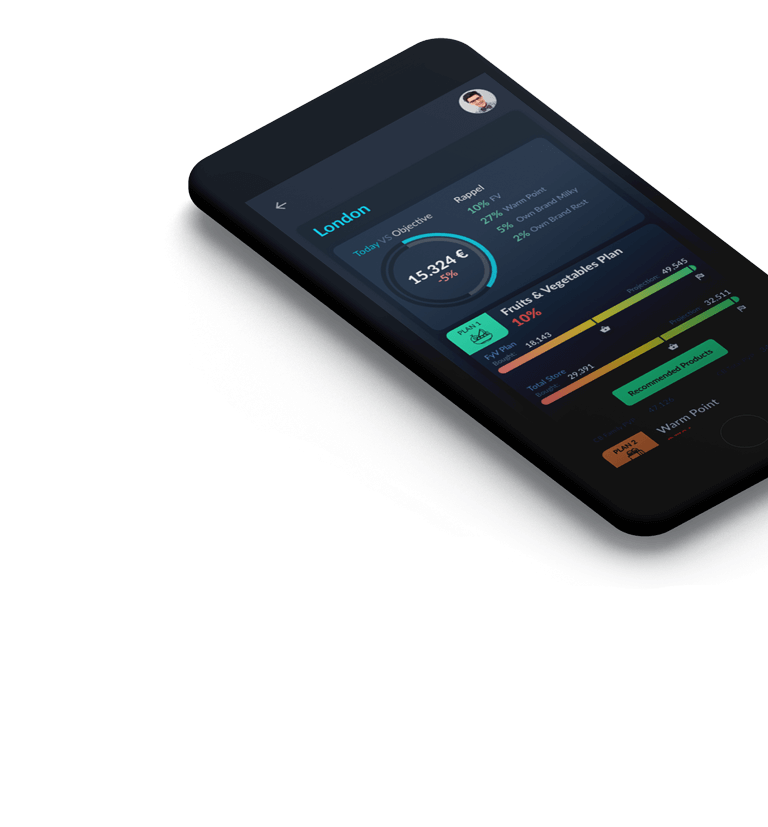
Development of a Sales Force app where in real time they have all the sales information

