
Data Talk
// Most read
360º Digitization
The digital transformation process can be exciting and full of opportunities, but it also brings with it a number of significant challenges.
// El blog
360º Digitization
The digital transformation process can be exciting and full of opportunities, but it also brings with it a number of significant challenges.

Towards a digitized and sustainable maritime future
Discover how the BeyondSea project is transforming maritime transport through digitalization and advanced technologies.

Zeus Talks 1: We talk with Amparo about Smart Visual Data
We interview Amparo García, CEO of Zeus by LLYC, in our Zeus Talks series. Check it out in our web and discover how important is data.

Unlock the power of your data: its importance through cinema
Data visualization has transformed the world through iconic films spanning from World War II to the digital age.

Data Storytelling: the magic of telling stories with data
Data Storytelling combines different forms of data visualization to tell stories in an engaging way. How does your company do it?

How does generative AI help in data visualization?
What is the role of generative AI in data visualization? How to go from a large volume of data to a visual dashboard – find out!
What is a SMART KPI and how to visualize it in a dashboard
How important it is to define a smart kpi and how to visualize it on a dashboard to empower teams and improve strategy.

Big Data in business: how to visualize data
How Big Data in business drives decision making. Explore the power of data visualization and turn data into insights.

Big data and Lego: building the data block by block
Big data and Lego have more in common than it seems. How to build stories block by block and what tips to follow.

What is Business Intelligence?
Business Intelligence is the ability of companies to give value to data and turn it into information. Having data is having power.

What is a dashboard: a complete guide
What is a dashboard. Find out how this visual tool helps you make informed decisions and what it must have to be effective.

Dashboard examples: transforming data into action
Discover the different examples of dashboards. Practical examples of commercial, logistic, marketing, etc. dashboard types.
Best data visualization practices and analysis
Discovering the best data visualization practices: from chart selection to effective colour use. How to visualize data?
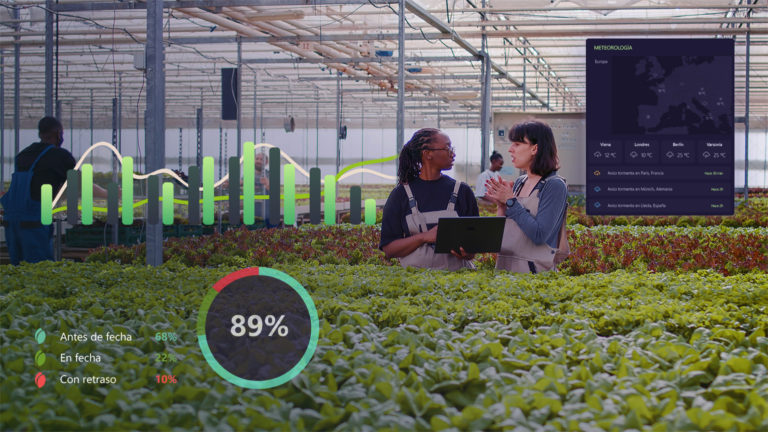
Agrotech and the importance of data in agriculture
Agrotech technology has become a benchmark of opportunities for rural development thanks to the power of data.
Guide to data visualization: what it is and practical examples
Discover this unique guide to data visualization. What is it and examples of use in dashboards: graphs, heat maps, etc.

Boosting the future of mobility
Digitalisation has burst into the world of electromobility as a fundamental factor for a successful electric transition.