This website uses cookies so that we can provide you with the best user experience possible. Cookie information is stored in your browser and performs functions such as recognising you when you return to our website and helping our team to understand which sections of the website you find most interesting and useful.
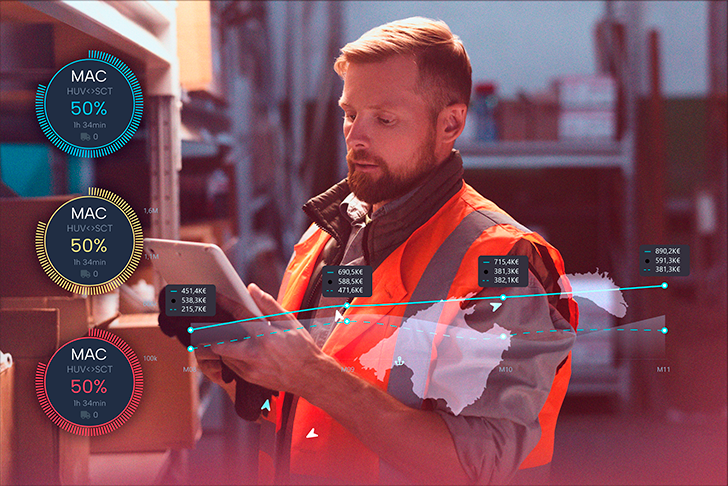
Information scattered in different software from different providers.
Slow ability to react to incidents.long times to identify, address and resolve problems.
Data chaos leads to multiple errors in shipment assignments, lack of control over the fleet, etc.
Lack of information and control over the status of orders prolongs response times to customers, affecting satisfaction with the service and the company’s reputation.
 ZEUS solution
 Real time tracking of each vehicle. Anticipate unforeseen events and make better planning of loads and deliveries. It also mitigates breakdowns, optimises deliveries and minimises consumption and costs.
Identify inefficient driving patterns, monitor the location and performance of each vehicle in your fleet to establish corrective measures. Optimise delivery routes based on traffic data and weather conditions.
Automatic generation of alerts for preventive vehicle maintenance and route optimisation.
Detailed information on the estimated time of arrival of the shipment, place of origin and destination or assigned carrier, which allows for more optimal management and fewer incidents.
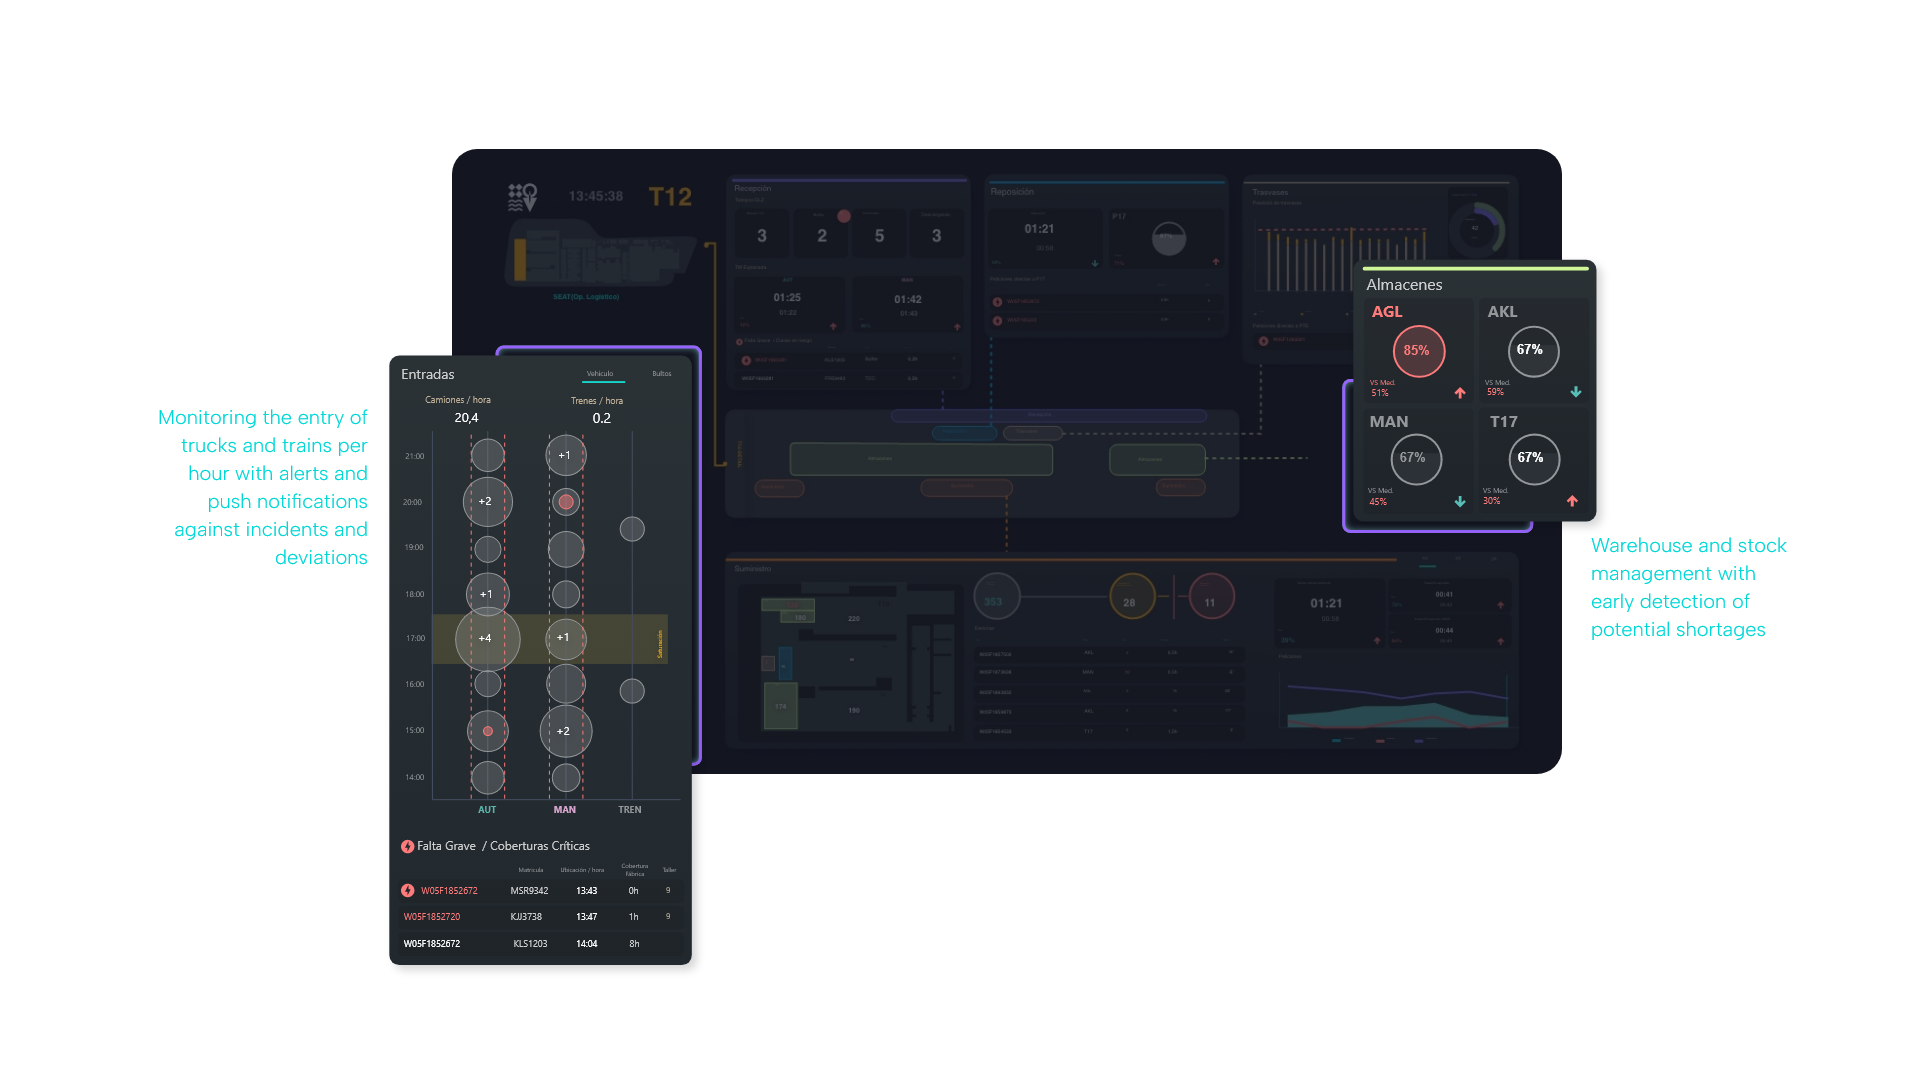
Visible data, agile decision-making
Data at the heart of every decision
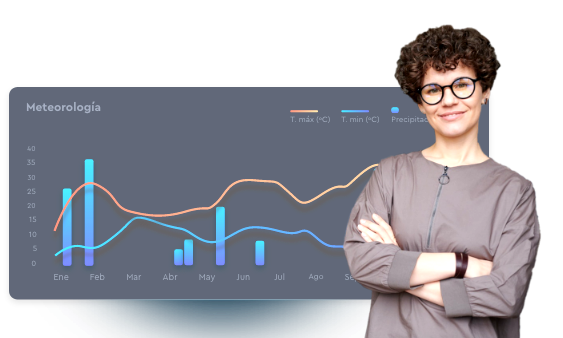
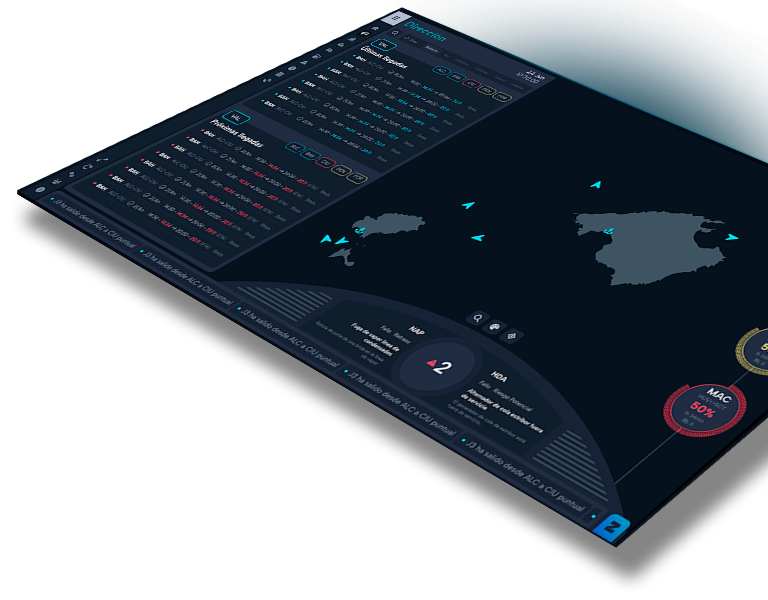

Command Center for the total control of the fleet of ships of the maritime logistics company Baleària.
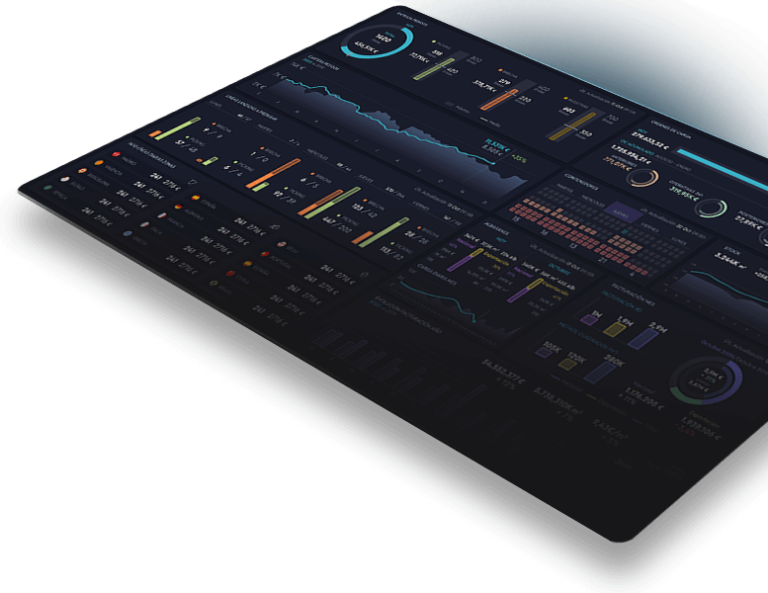
Fleet Control Tower using artificial intelligence and big data tools.
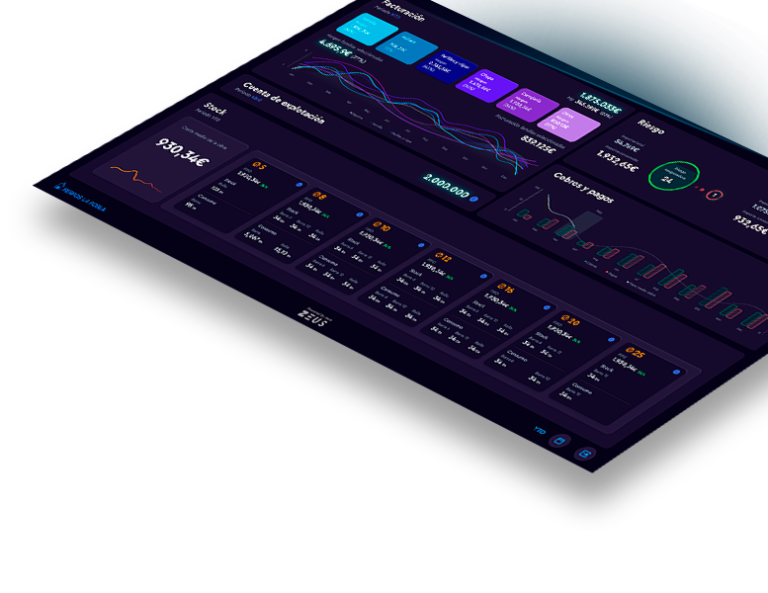

Development of a 6-view videowall to improve customer and supplier relations.
Monitoring of all customer activity through a videowall with real-time data.
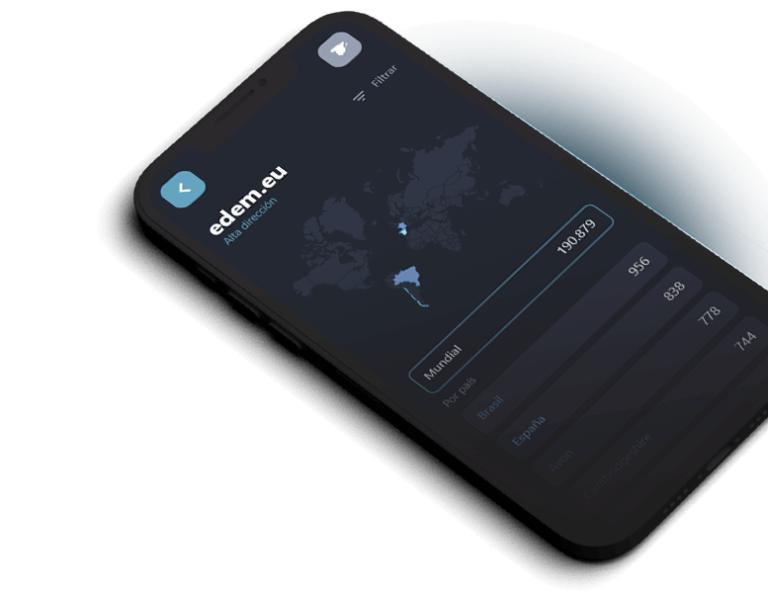
Development of a mobile dashboard for marketing and sales teams to make better decisions.
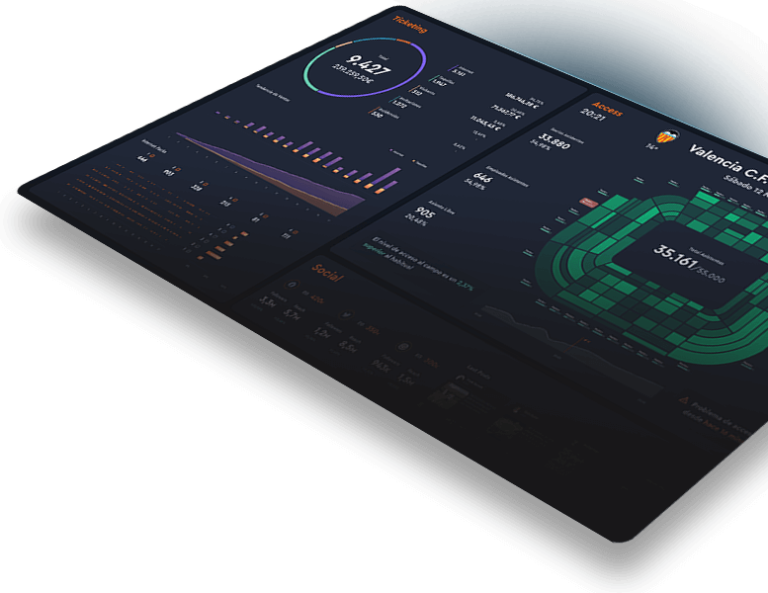
Valencia CF had scattered information to consult in different sources, wasting a lot of time analyzing and interpreting it. Through the videowall they have the data centralized and updated in real time.
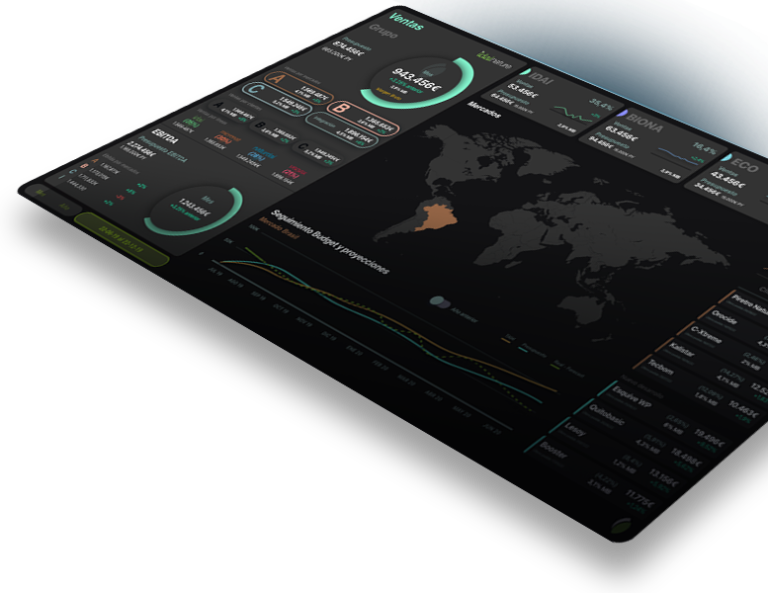
A project with 5 dashboards to give managers a transversal view of the company.
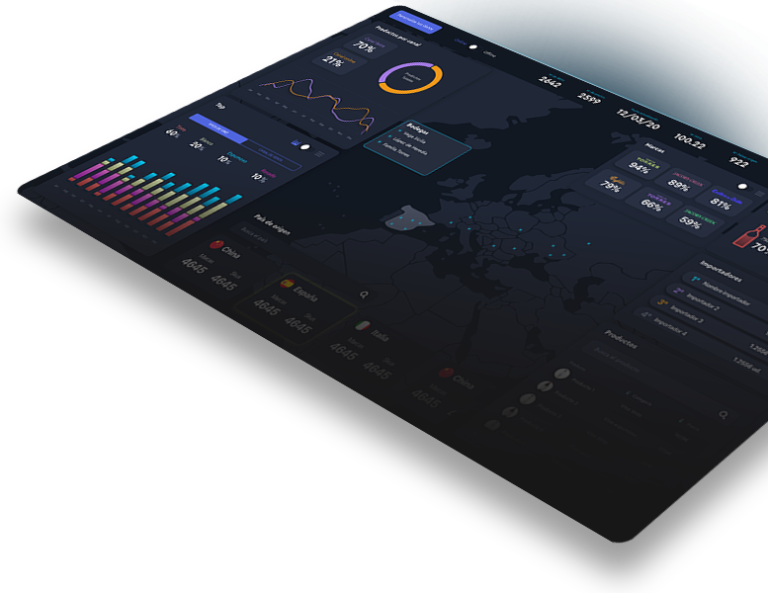
Business dashboard for companies exporting products to have a real-time analysis of the state of trade and the main KPIs.
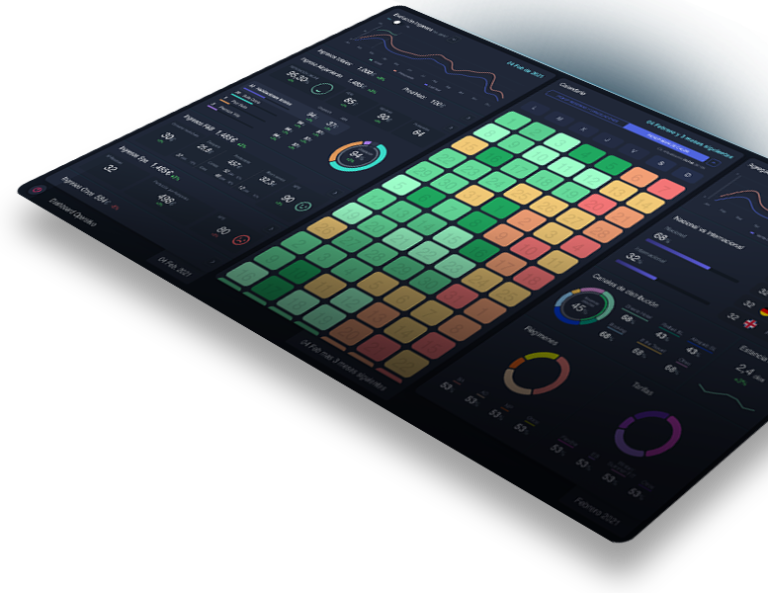
Operational and customer dashboard to optimize decision making and improve customer experience.
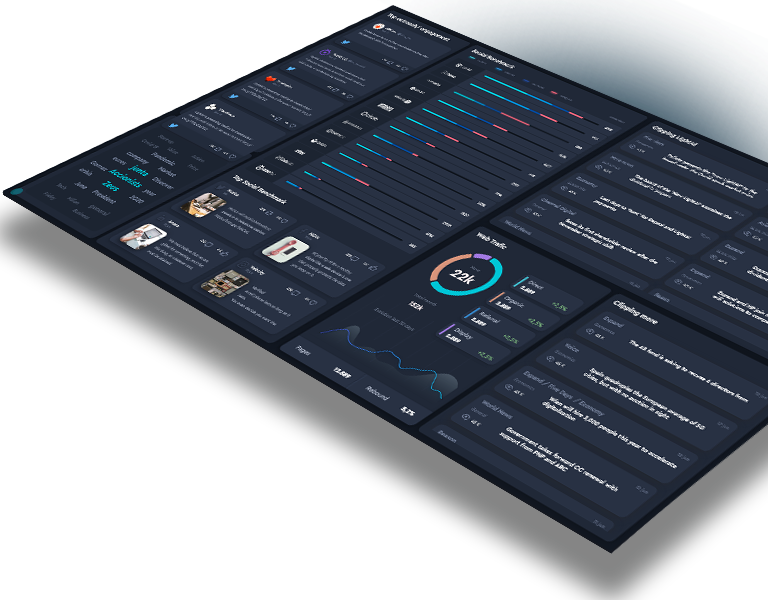
Social Dashboard that integrates all business metrics. Monitoring objectives accompanied by key general information.
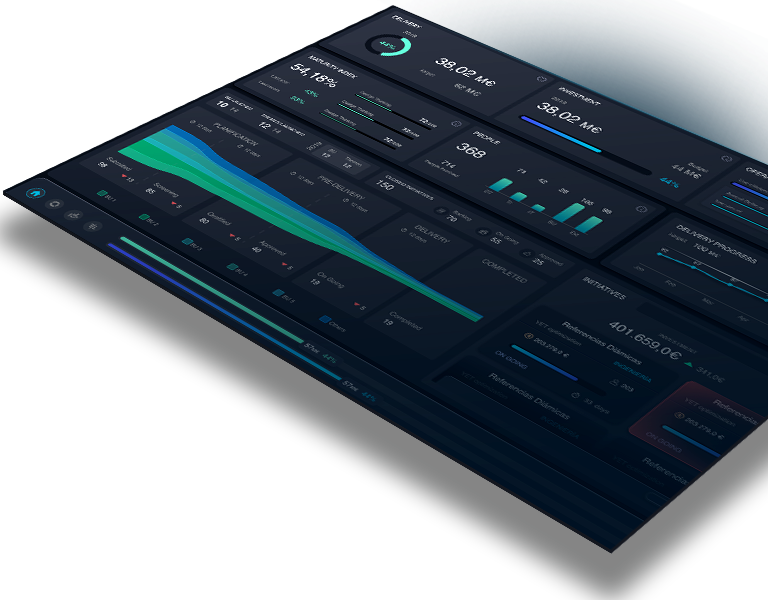
Possibility to choose a business unit through a pull down menu or a filter and the widgets are recalculated according to the data of each unit.
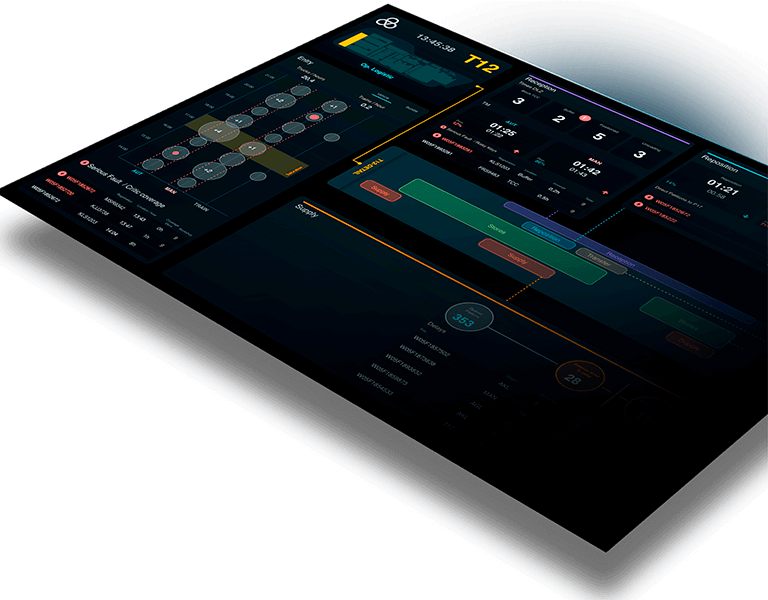
An information surveillance system for the entire supply chain
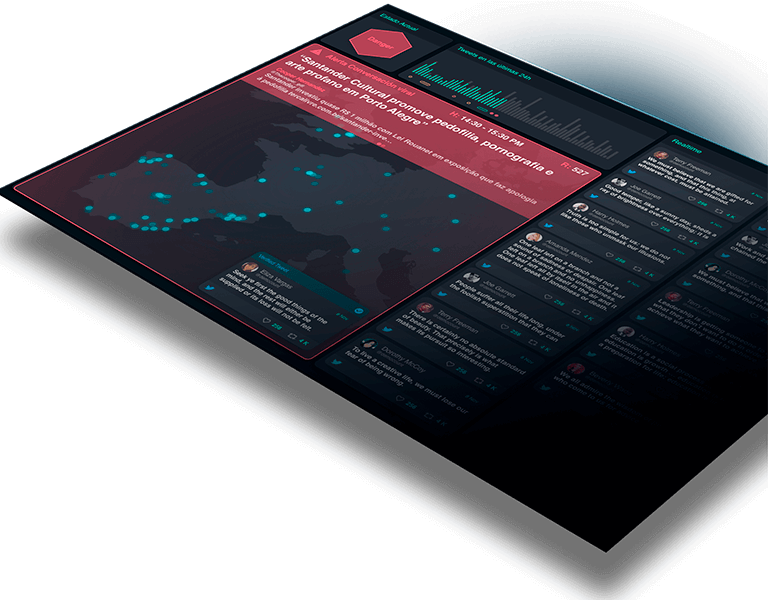
One of the most complete video walls on the market, which integrates more than 12 sources of information.
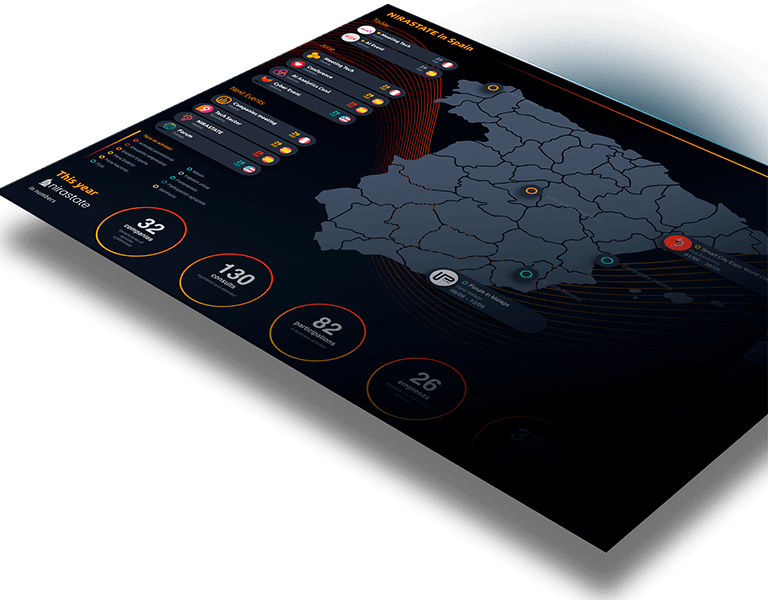
Need to make visible all the communication and business activity
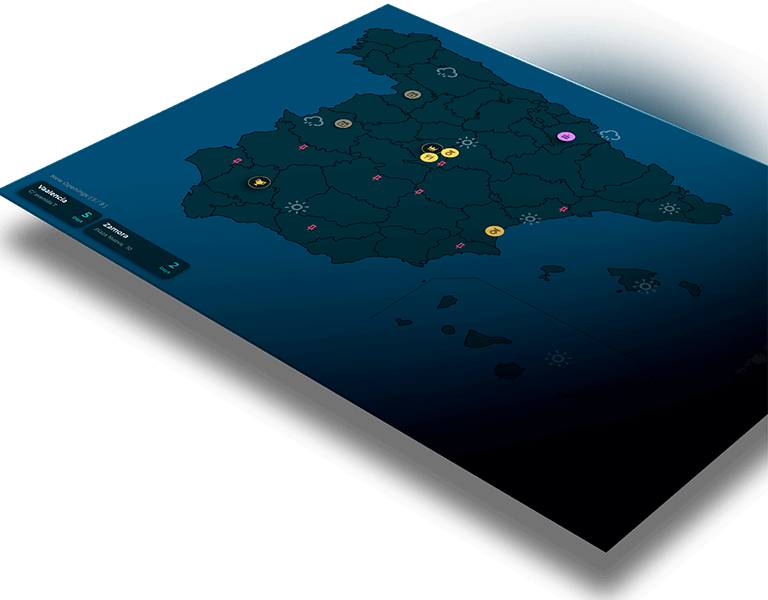
Complete Smart Visual data project for restaurant and equipment management
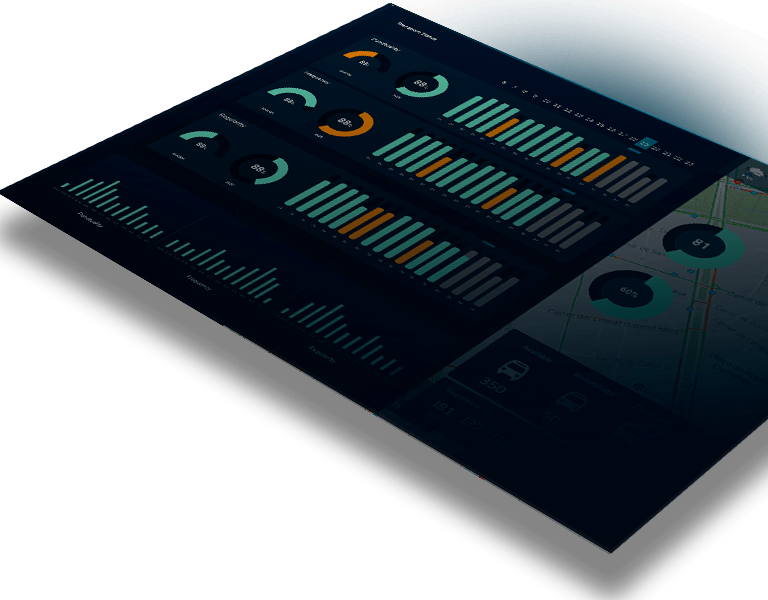
Dashboard that monitors the Traffic Regulation Center of the EMT Operations to work in a more effective and efficient way.
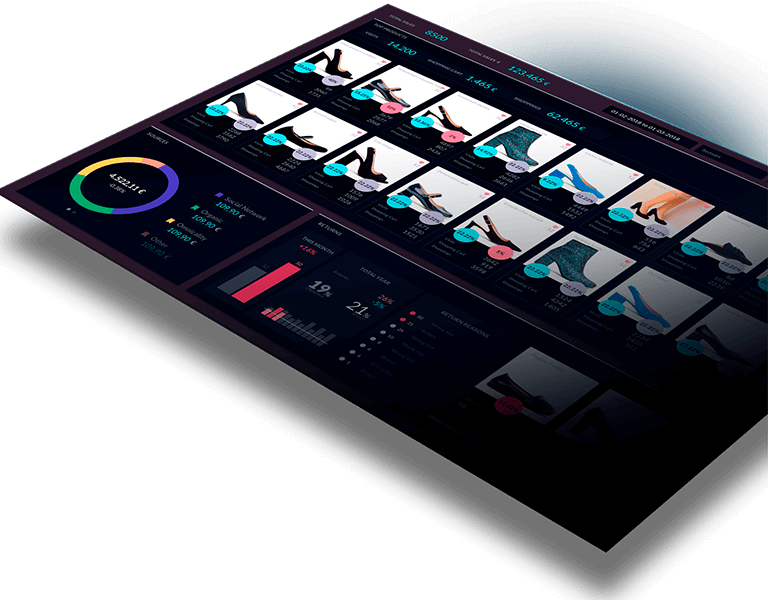
Sales analysis, product comparison, efficiency of advertising campaigns. All in real time
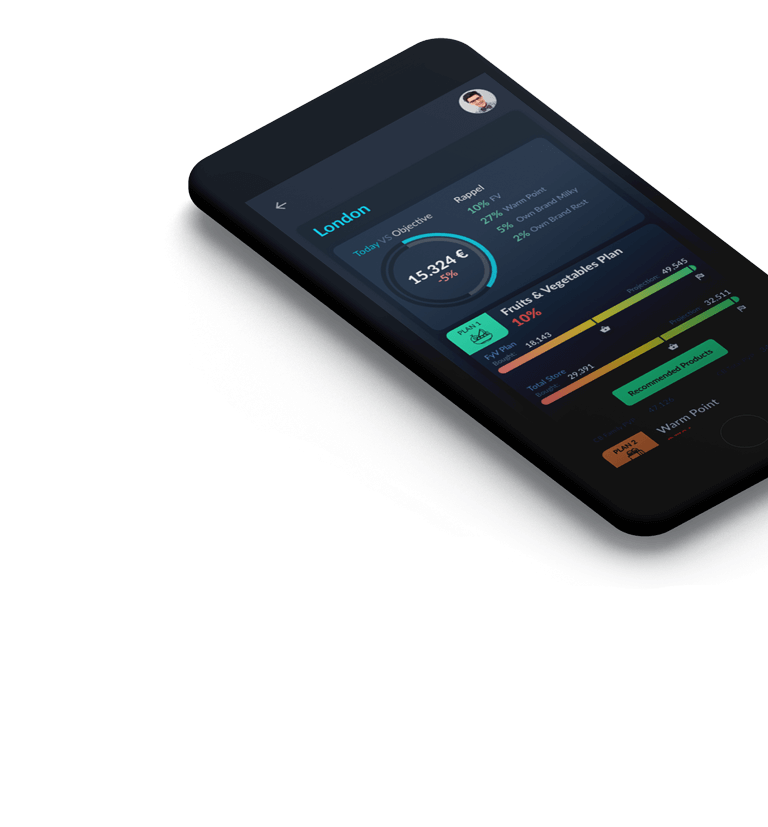
Development of a Sales Force app where in real time they have all the sales information

