Information from different sources – weather data, soil data, crop records – can limit farmers’ ability to make agile decisions.
The inability to accurately predict the occurrence of pests and diseases in crops can affect the quality of the final product and the efficiency of farm process management.
Lack of accurate tools to monitor crop quality can lead to inefficient farming practices, affecting crop health and final product quality.
Difficulties in establishing effective traceability systems from production to distribution which can affect quality and the ability to respond quickly to problems in the supply chain.
 ZEUS solution
 Use of advanced algorithms to predict pests, diseases and adverse weather conditions. This allows preventive measures to be taken, improving quality and optimising processes.
Unification of various data sources, providing a cross-sectional view that facilitates informed decision making and optimising resources (water, fertilisers and pesticides) thanks to the rapid detection of problems.
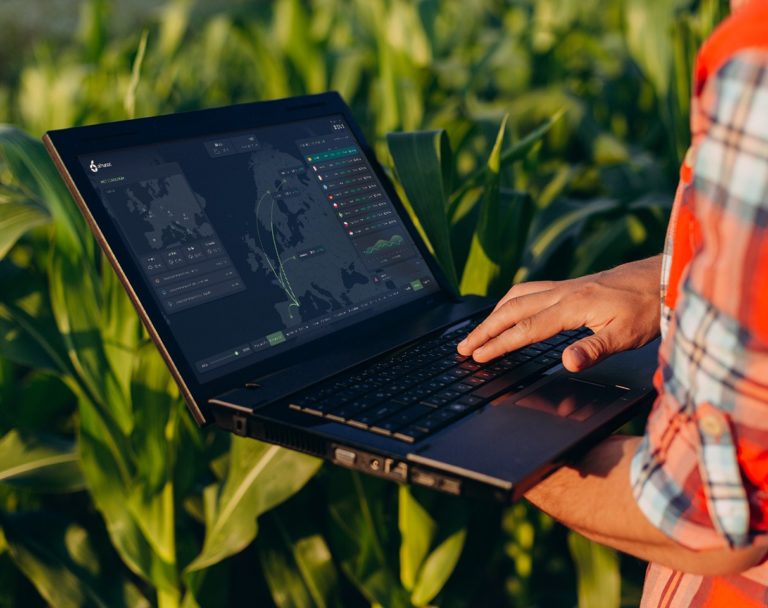
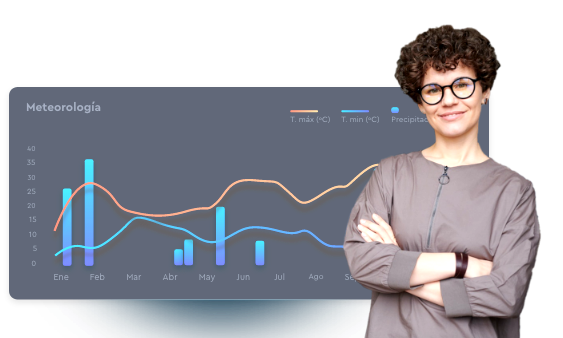
It allows farmers and decision-makers to instantly monitor critical data: weather conditions, soil moisture levels, crop condition, etc. No need to wait for regular reports.
Real-time visualization enables optimization of transport routes, efficient inventory management and product freshness.
Visible data, agile decision-making
Data at the heart of every decision
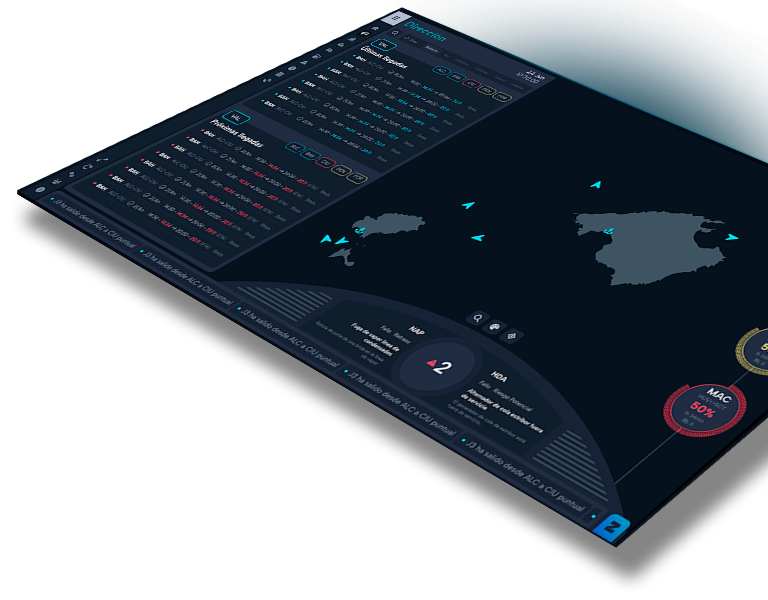

Command Center for the total control of the fleet of ships of the maritime logistics company Baleària.
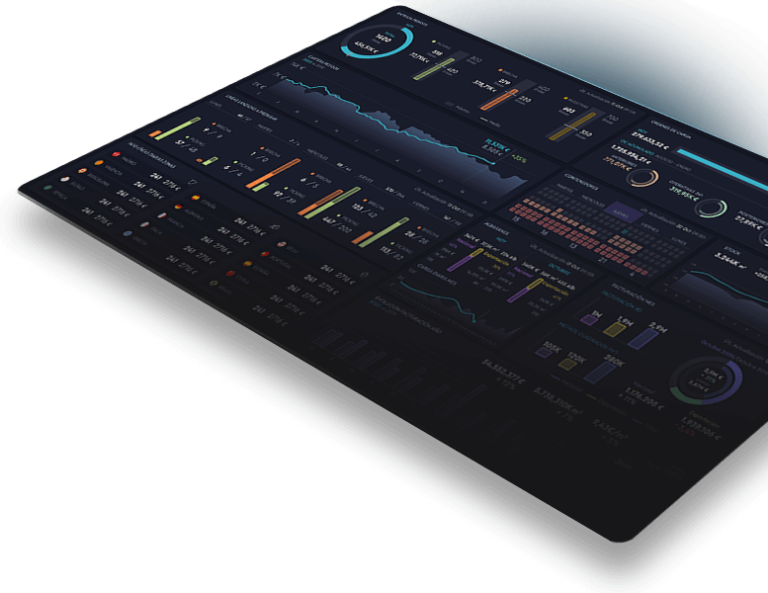
Fleet Control Tower using artificial intelligence and big data tools.
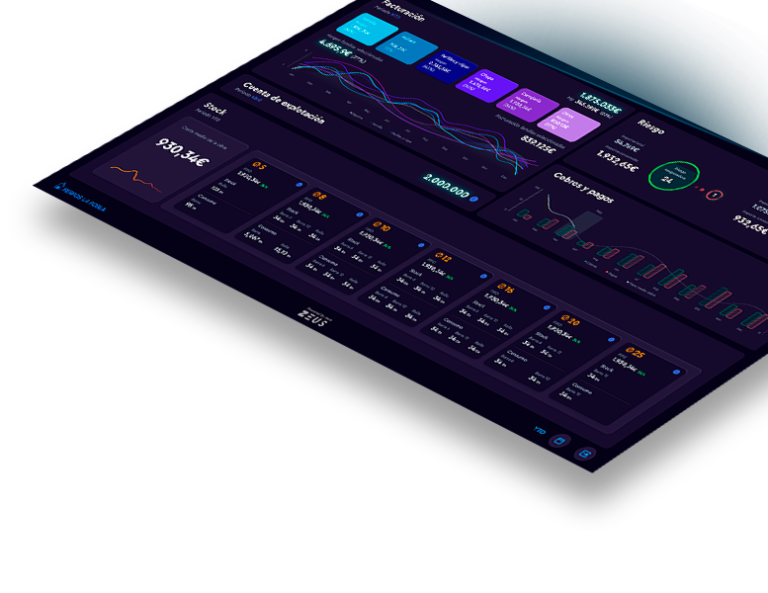

Development of a 6-view videowall to improve customer and supplier relations.
Monitoring of all customer activity through a videowall with real-time data.
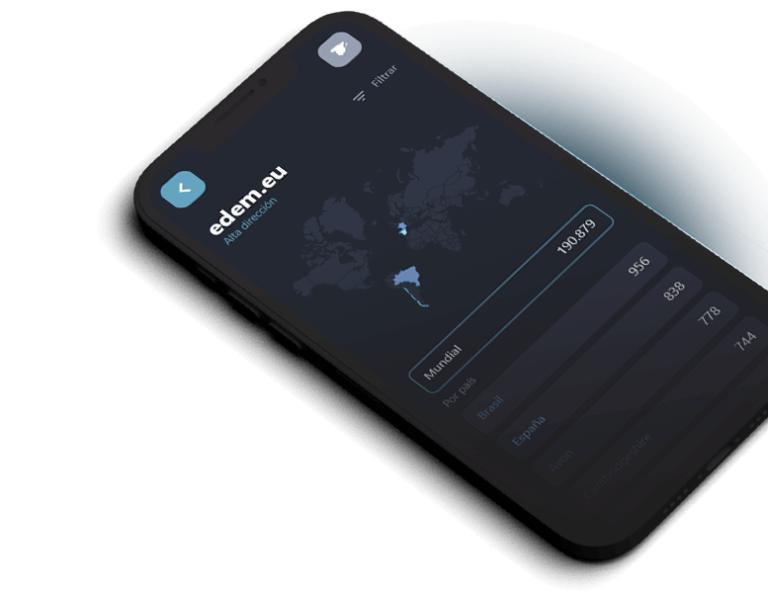
Development of a mobile dashboard for marketing and sales teams to make better decisions.
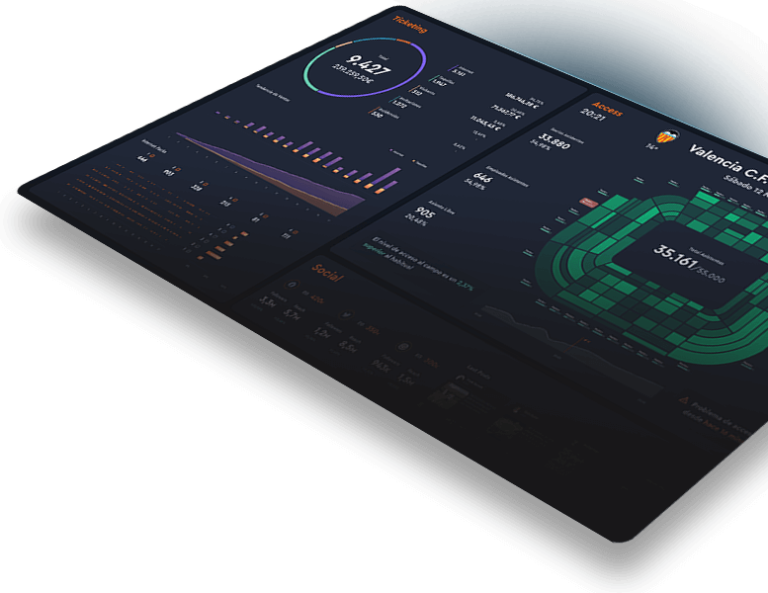
Valencia CF had scattered information to consult in different sources, wasting a lot of time analyzing and interpreting it. Through the videowall they have the data centralized and updated in real time.
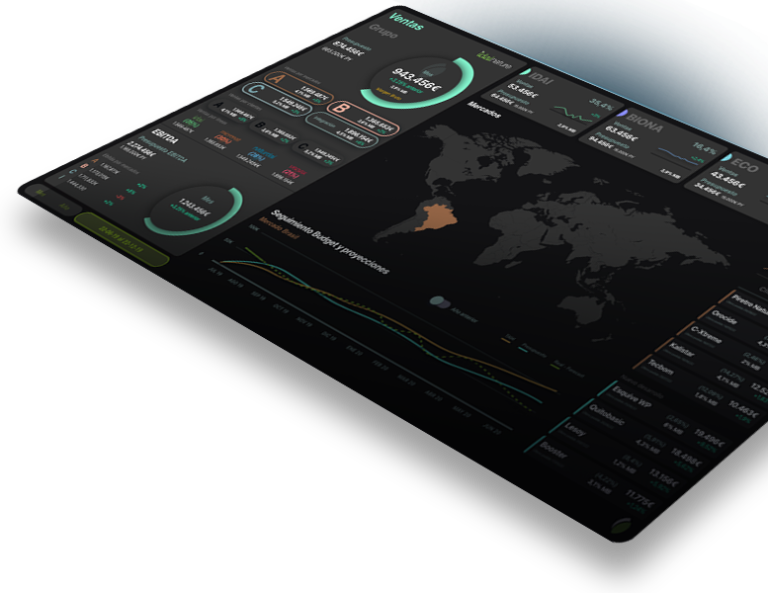
A project with 5 dashboards to give managers a transversal view of the company.
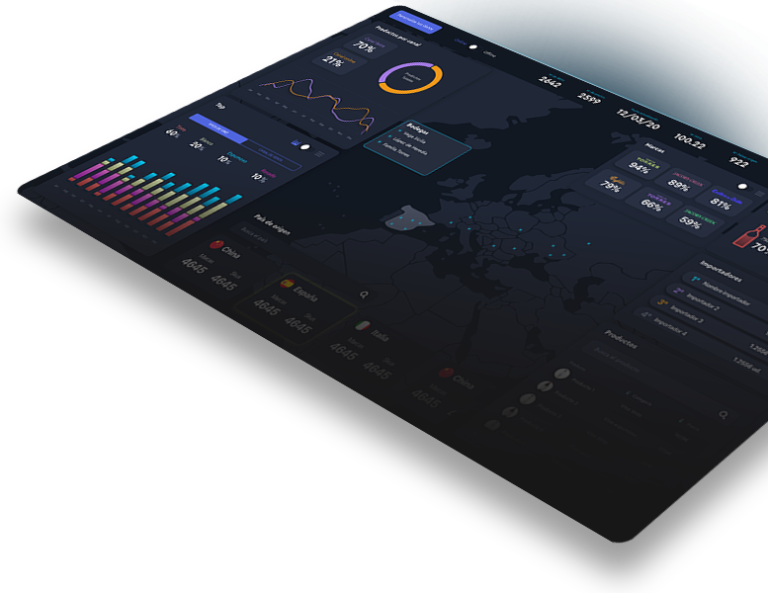
Business dashboard for companies exporting products to have a real-time analysis of the state of trade and the main KPIs.
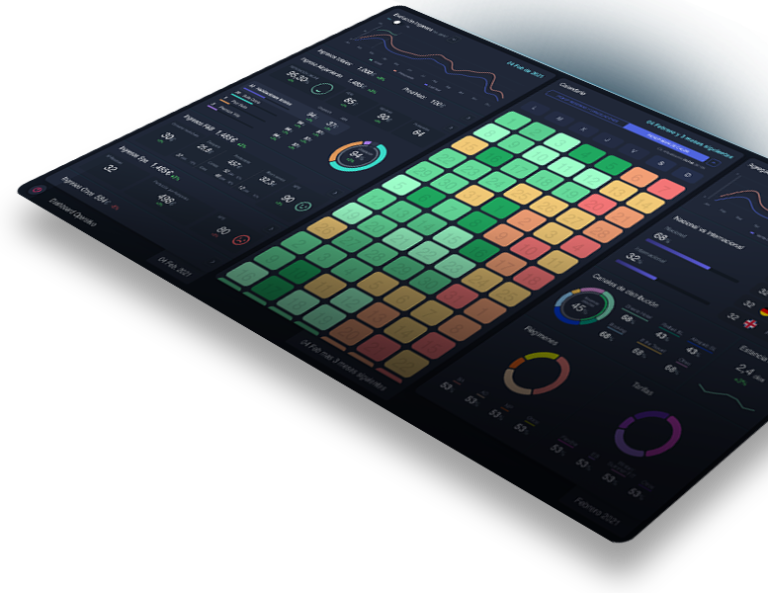
Operational and customer dashboard to optimize decision making and improve customer experience.
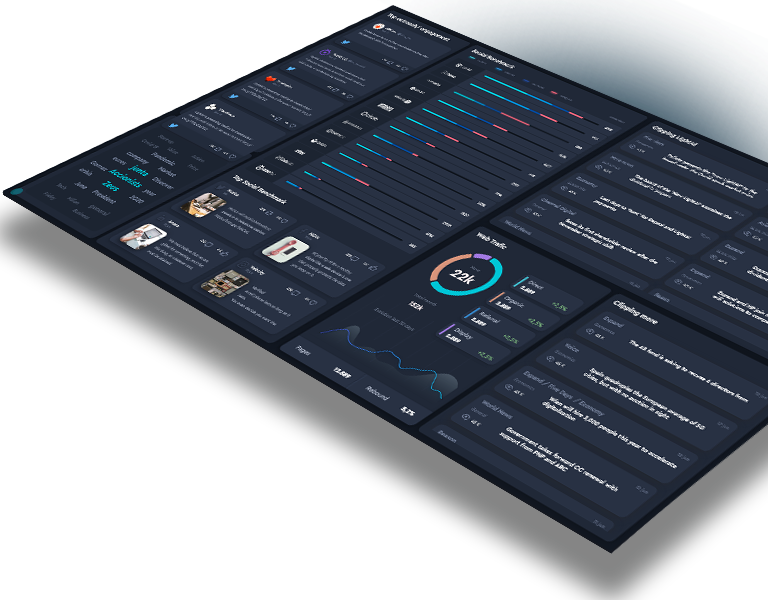
Social Dashboard that integrates all business metrics. Monitoring objectives accompanied by key general information.
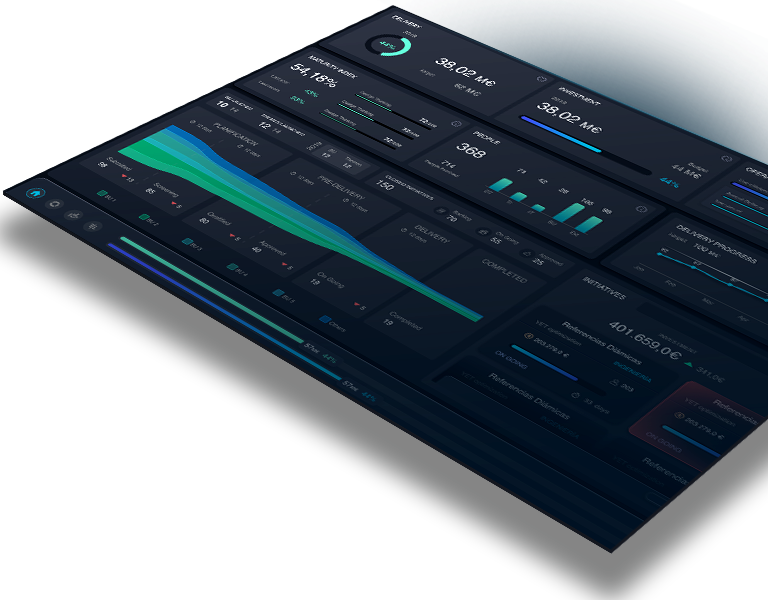
Possibility to choose a business unit through a pull down menu or a filter and the widgets are recalculated according to the data of each unit.
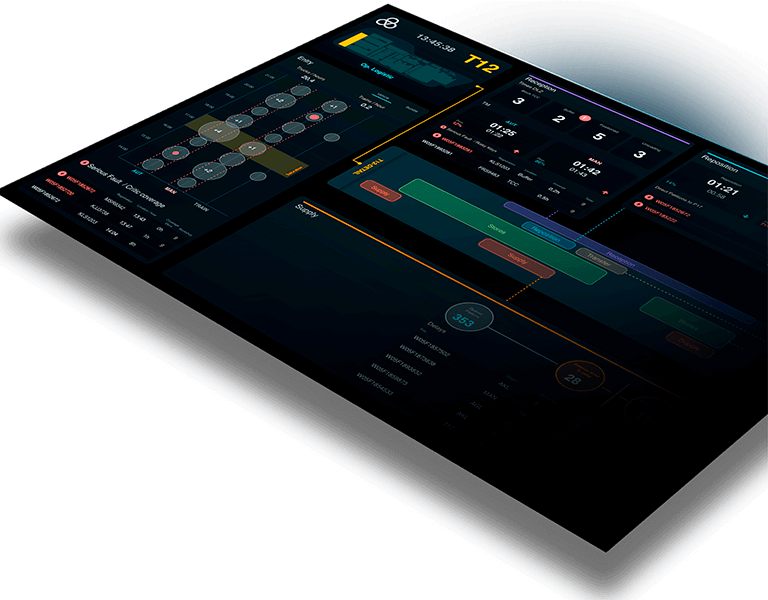
An information surveillance system for the entire supply chain
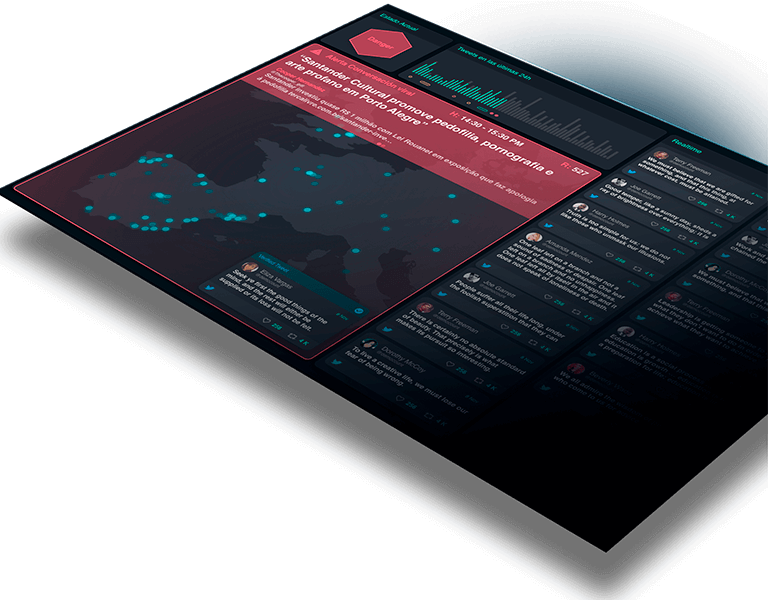
One of the most complete video walls on the market, which integrates more than 12 sources of information.
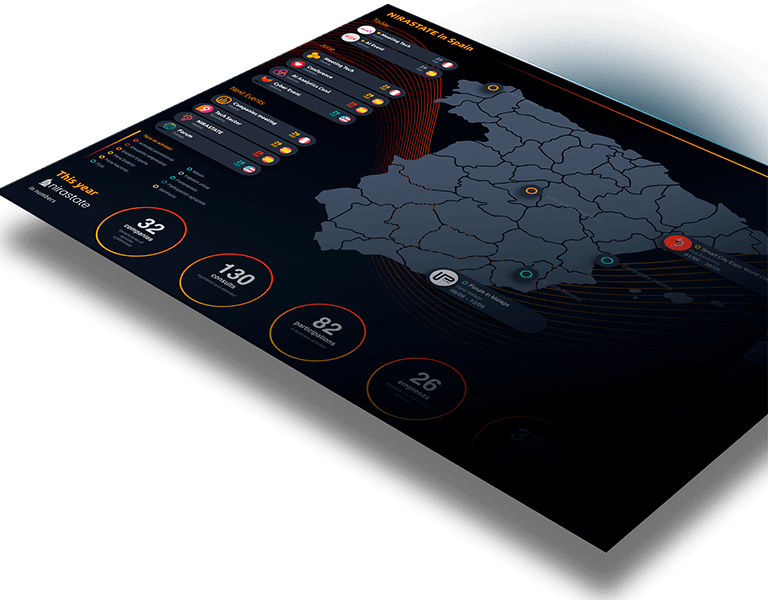
Need to make visible all the communication and business activity
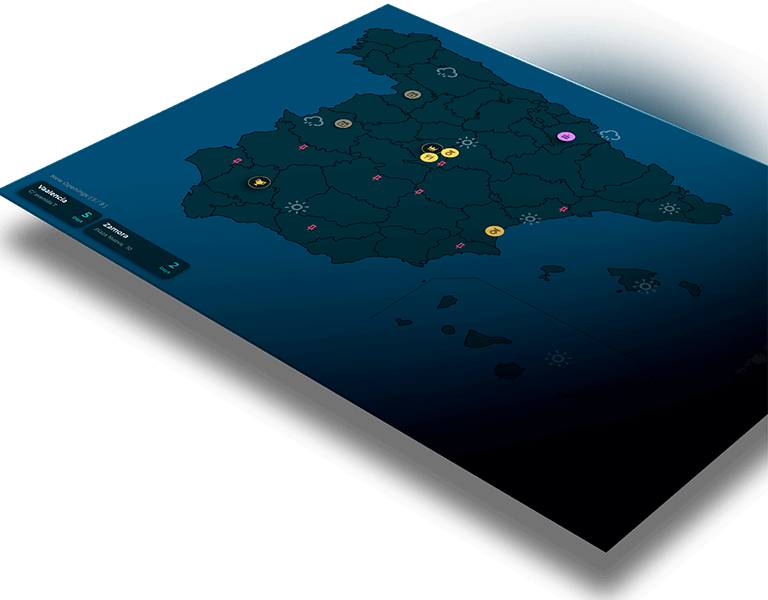
Complete Smart Visual data project for restaurant and equipment management
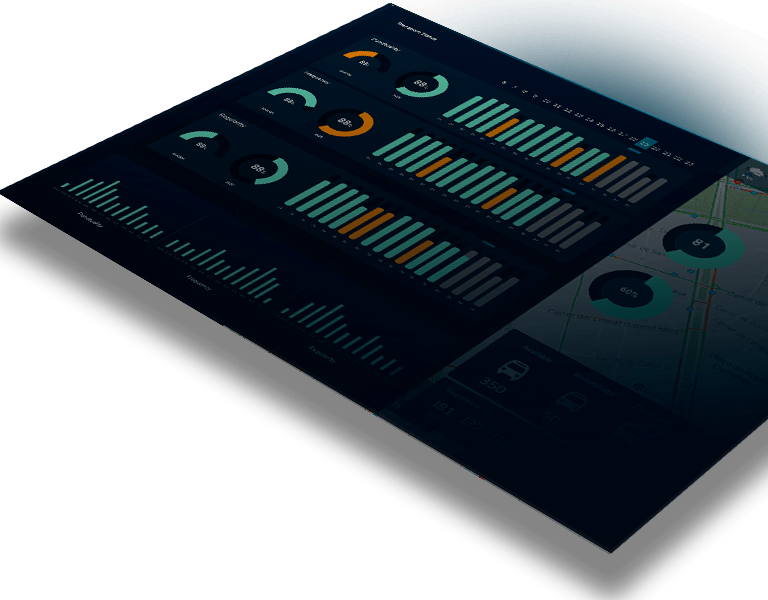
Dashboard that monitors the Traffic Regulation Center of the EMT Operations to work in a more effective and efficient way.
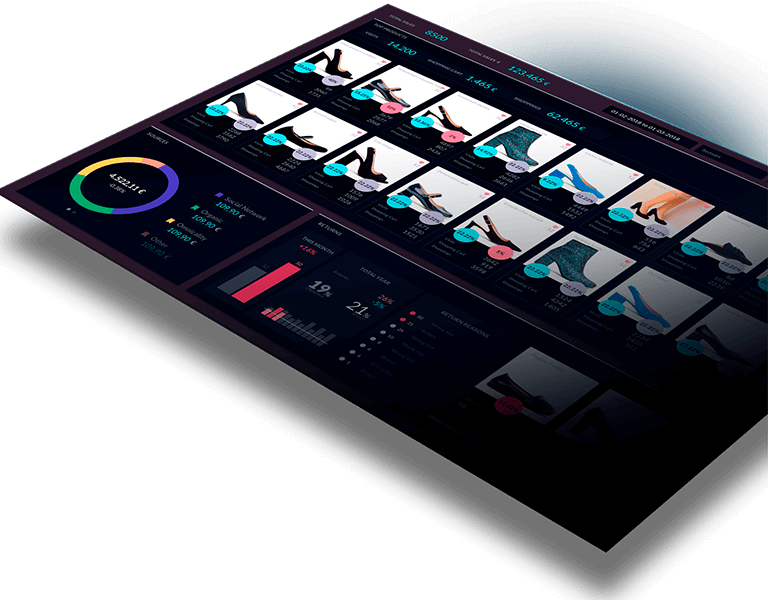
Sales analysis, product comparison, efficiency of advertising campaigns. All in real time
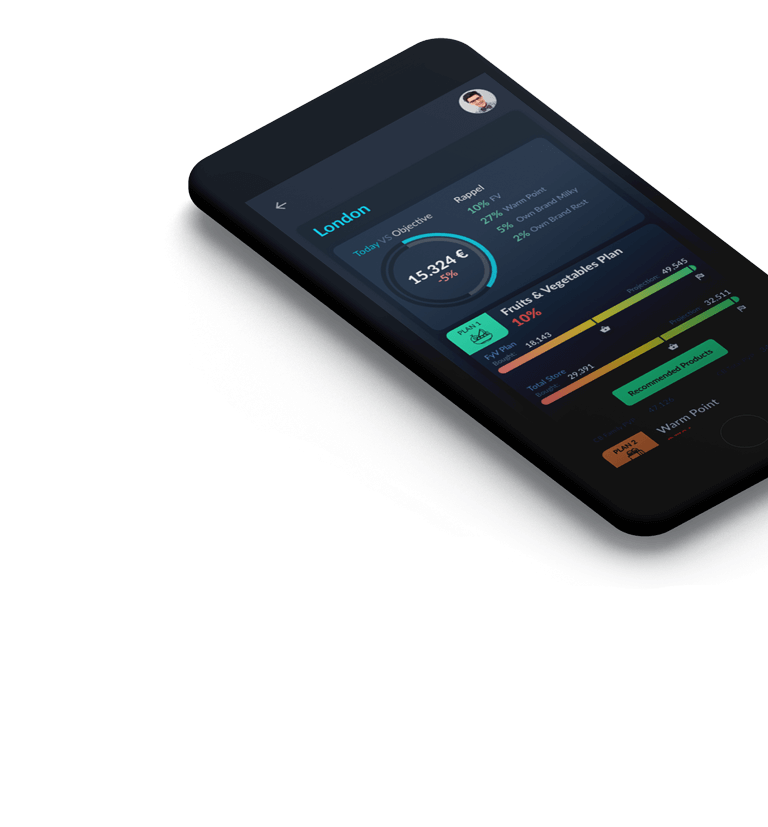
Development of a Sales Force app where in real time they have all the sales information
