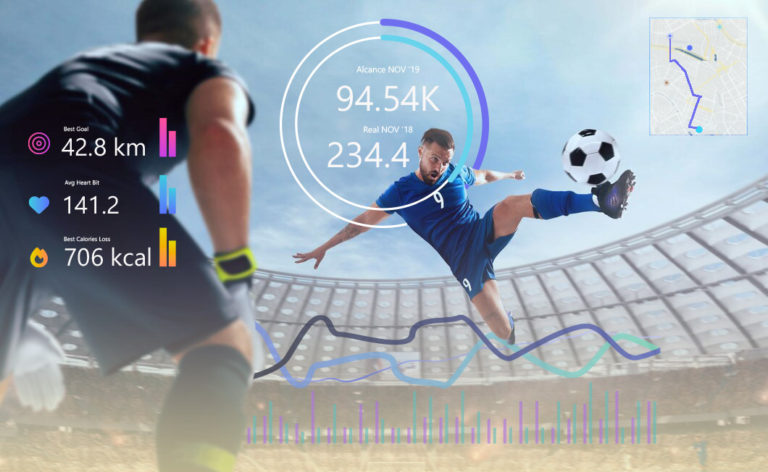
Generation by the clubs of much more information beyond the matches played: ticket sales, museum tours, food and drink purchased during the match or merchandising in the official shop.
BI tools do not fit the complex needs and specificities of sport management, being inflexible and limiting their ability to adapt to the dynamics and challenges of each discipline.
Loss of valuable economic opportunities that prevent clubs from maximising their profitability and limit their financial capacity and potential.
Difficulty in interpreting data effectively, limiting the ability to generate a deeper bond with the fan; hindering the creation of more personalised and engaging experiences.
 ZEUS solution
 A digital space where departments converge: a videowall to analyse KPIs in real time, merging online and offline data. A synergy in sports management and sound decision making.
Intuitive dashboard that simplifies the process so that area managers spend as little time as possible when making decisions. An efficient, agile and accurate experience to confidently lead the sports industry through data.
Anticipate your fans’ wishes, improve their shopping experience and make them fall in love with the club even more. Exceed their expectations around matches and the club.
Complete and detailed insight into the evolution of your club in numbers. Discover growth opportunities, identify patterns of success and drive your goals through the sports management dashboard.
Visible data, agile decision-making
Data at the heart of every decision
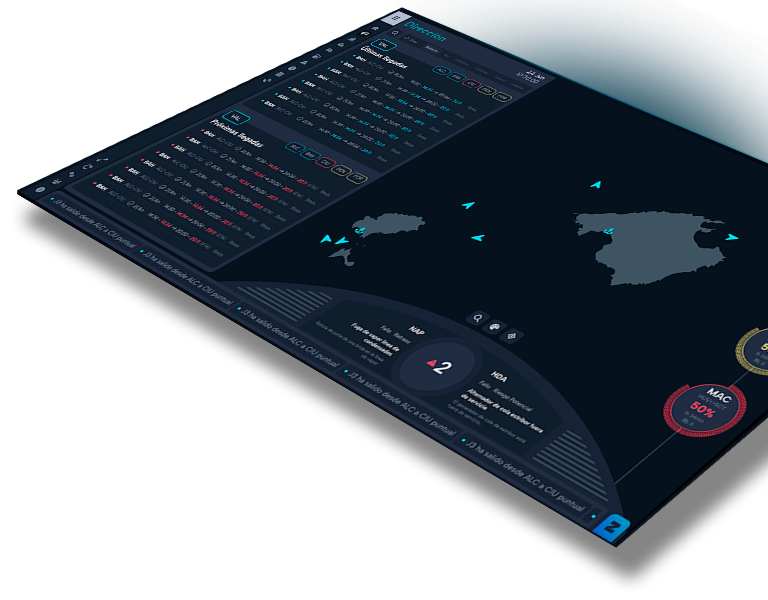

Command Center for the total control of the fleet of ships of the maritime logistics company Baleària.
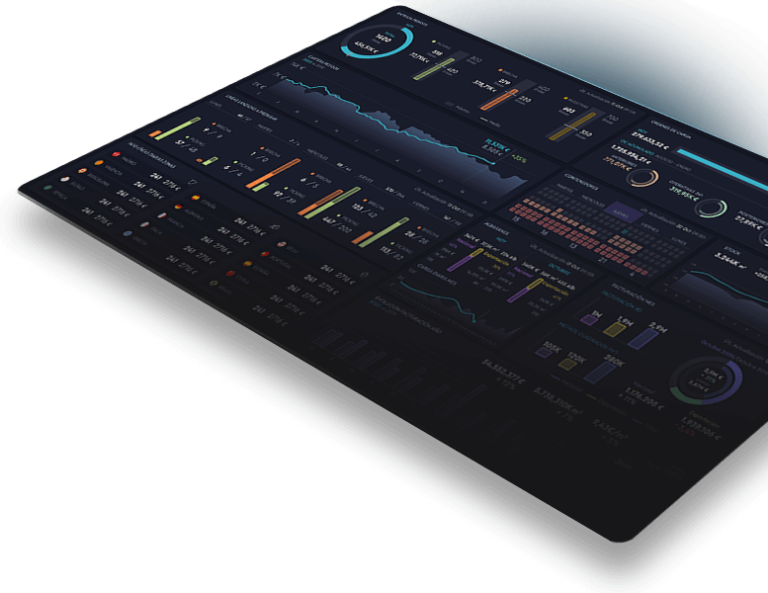
Fleet Control Tower using artificial intelligence and big data tools.
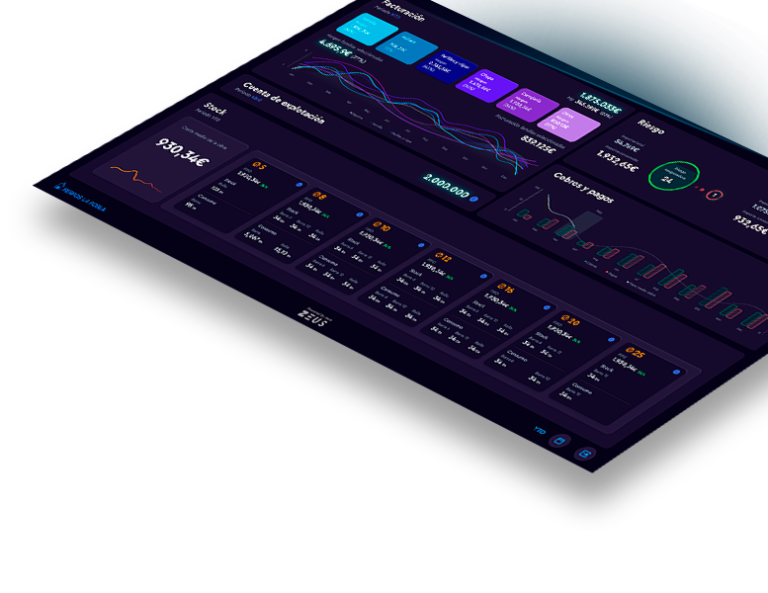

Development of a 6-view videowall to improve customer and supplier relations.
Monitoring of all customer activity through a videowall with real-time data.
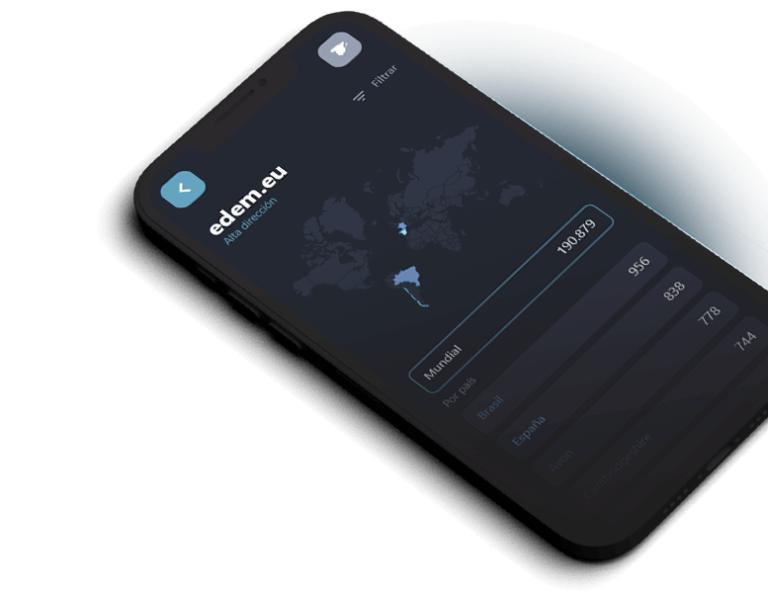
Development of a mobile dashboard for marketing and sales teams to make better decisions.
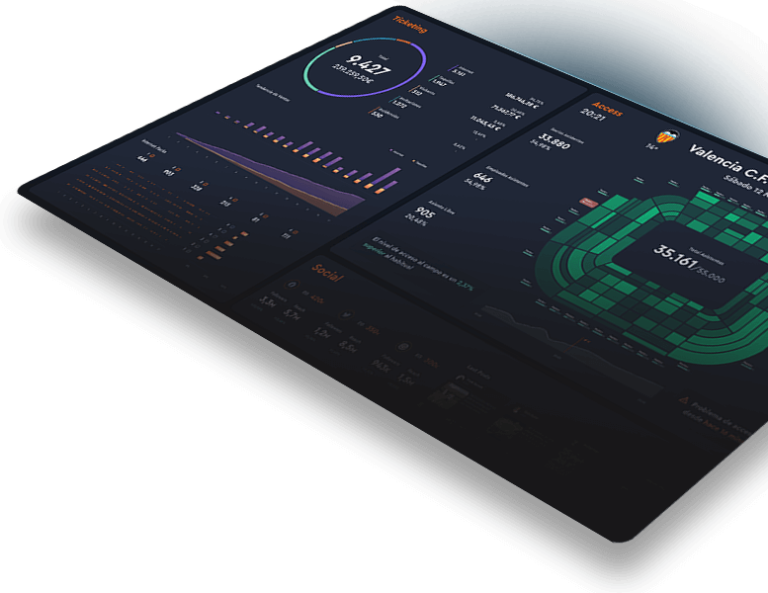
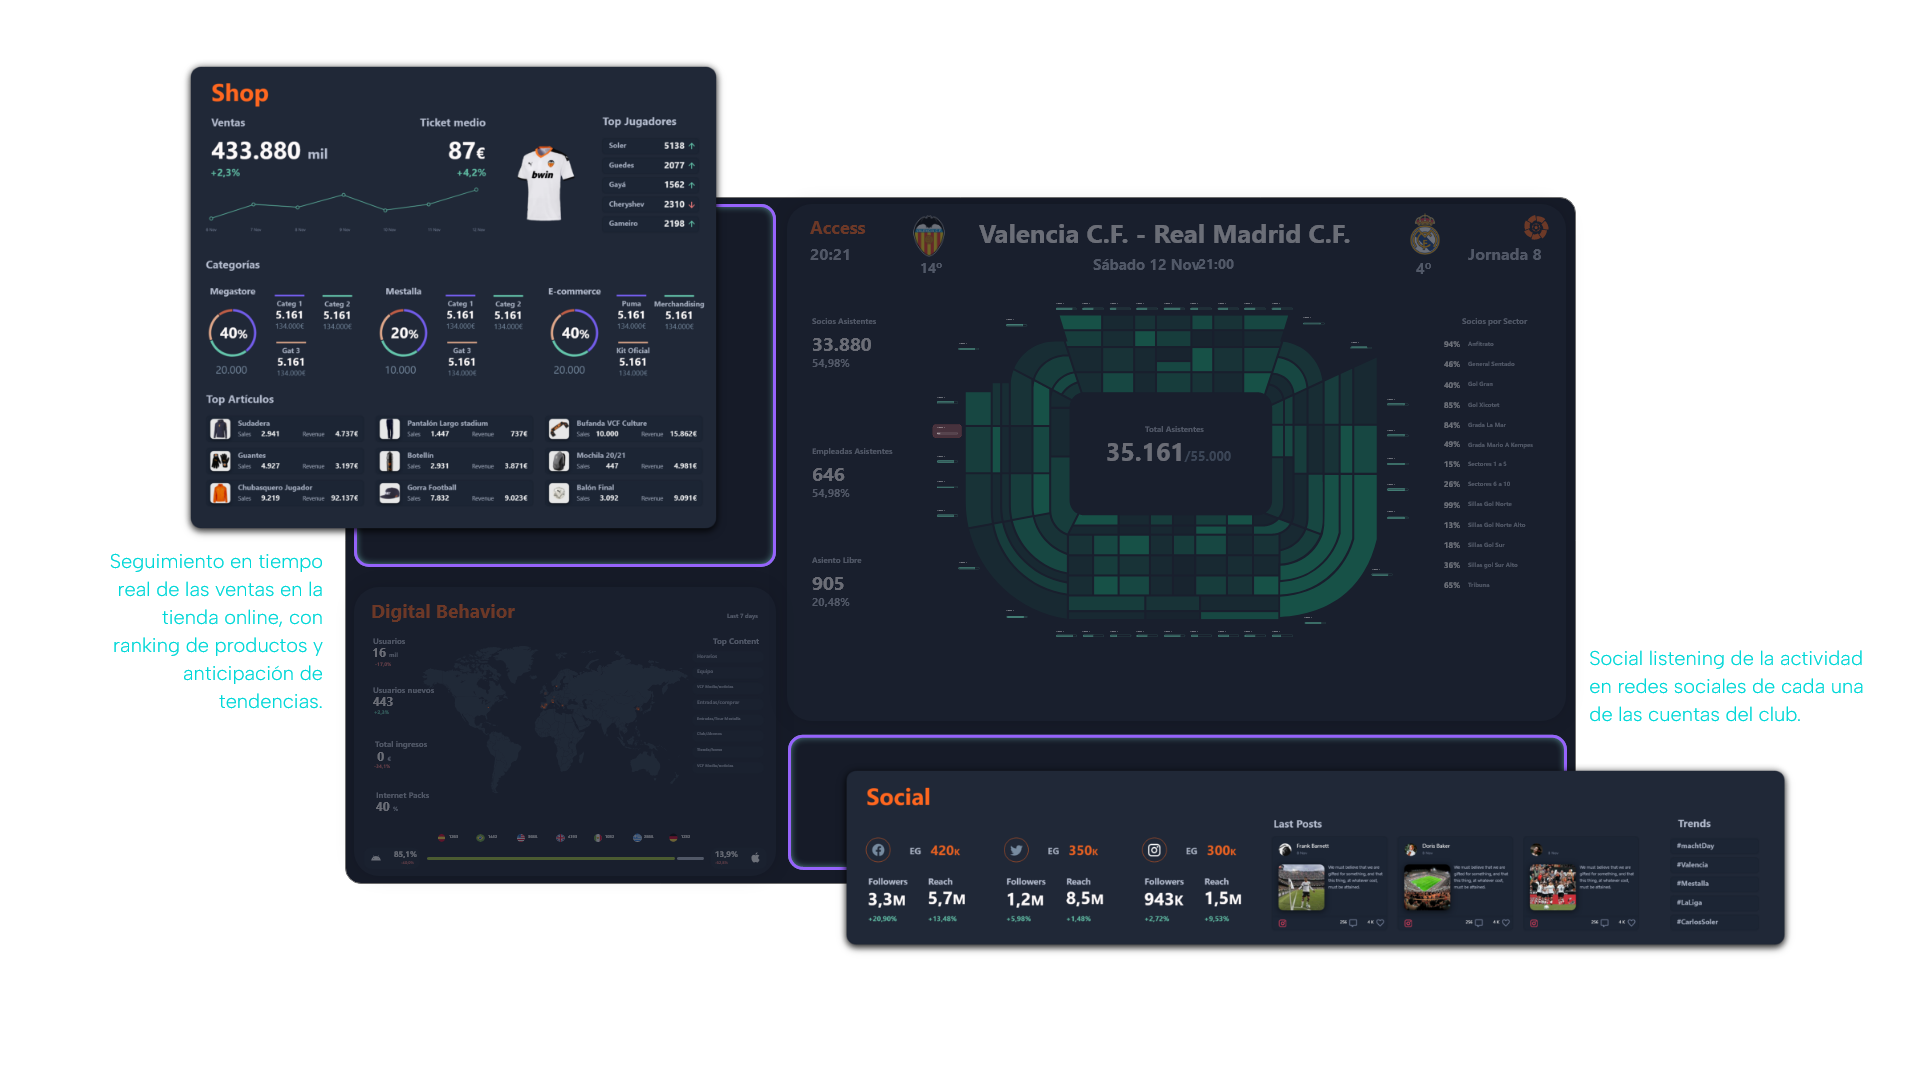
Valencia CF had scattered information to consult in different sources, wasting a lot of time analyzing and interpreting it. Through the videowall they have the data centralized and updated in real time.
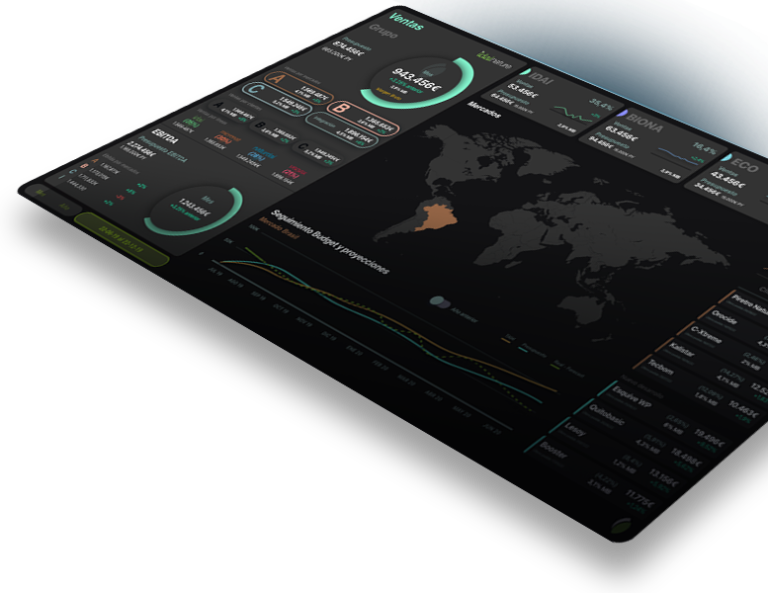
A project with 5 dashboards to give managers a transversal view of the company.
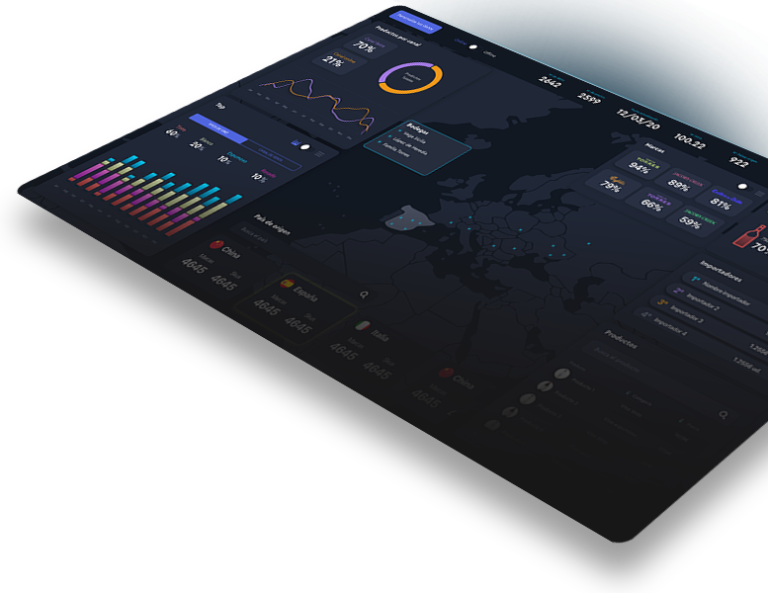

Business dashboard for companies exporting products to have a real-time analysis of the state of trade and the main KPIs.
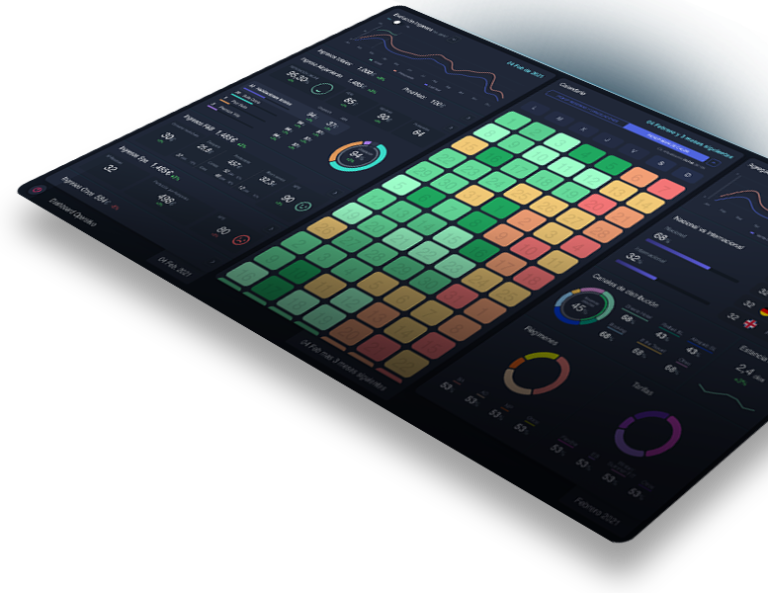
Operational and customer dashboard to optimize decision making and improve customer experience.
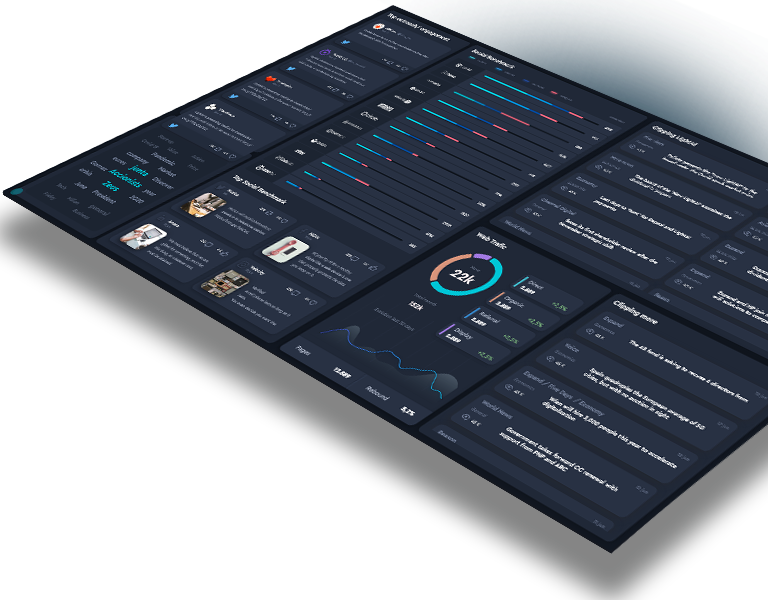
Social Dashboard that integrates all business metrics. Monitoring objectives accompanied by key general information.
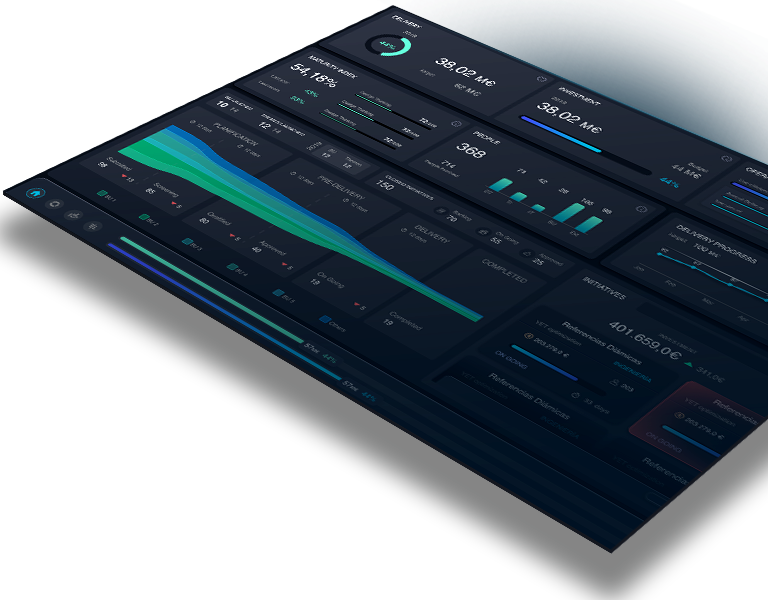
Possibility to choose a business unit through a pull down menu or a filter and the widgets are recalculated according to the data of each unit.
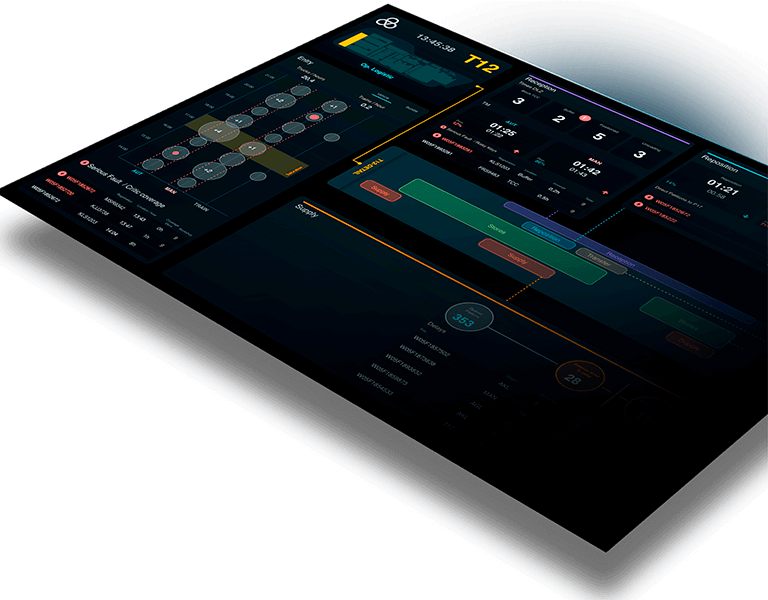
An information surveillance system for the entire supply chain
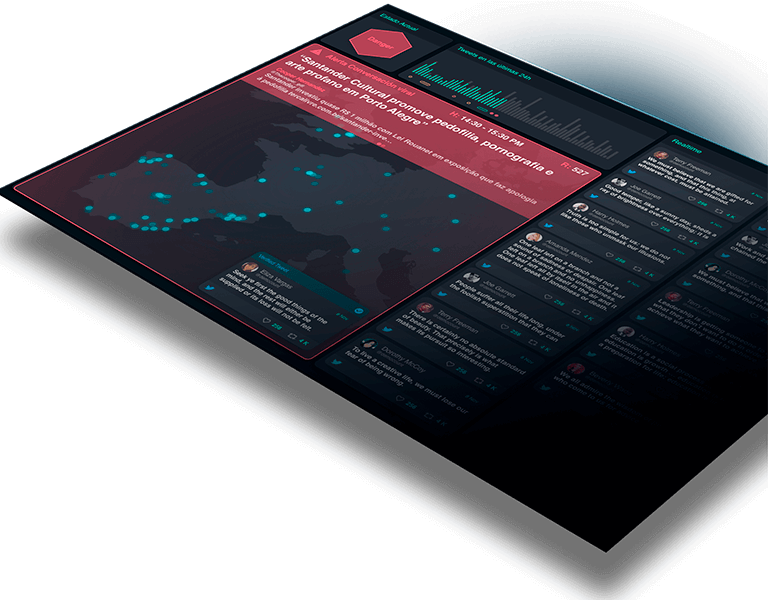
One of the most complete video walls on the market, which integrates more than 12 sources of information.
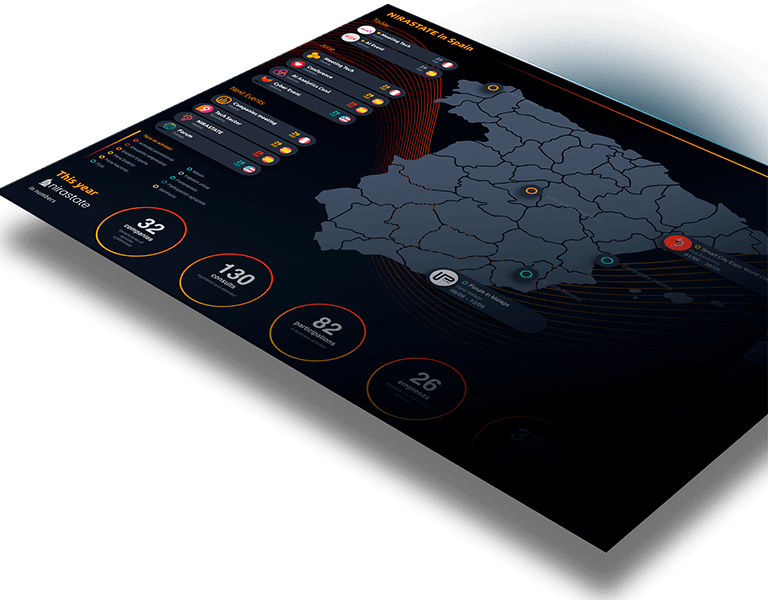
Need to make visible all the communication and business activity
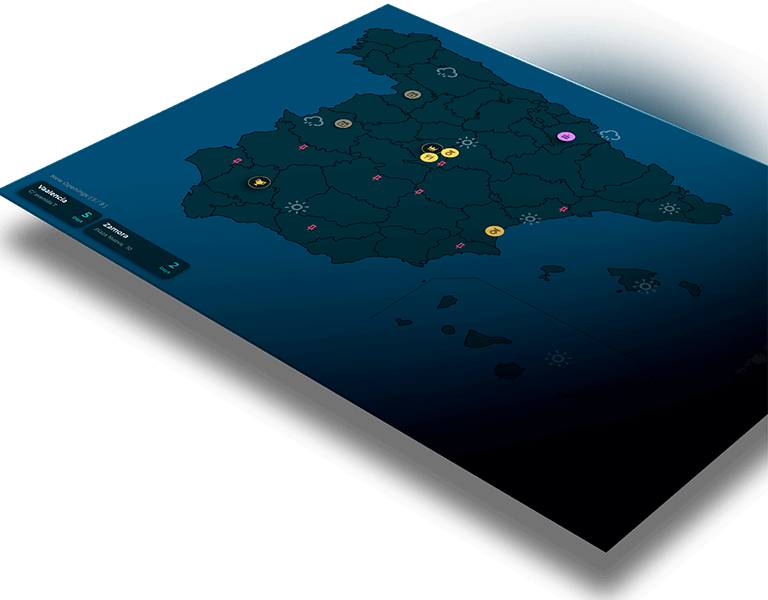
Complete Smart Visual data project for restaurant and equipment management
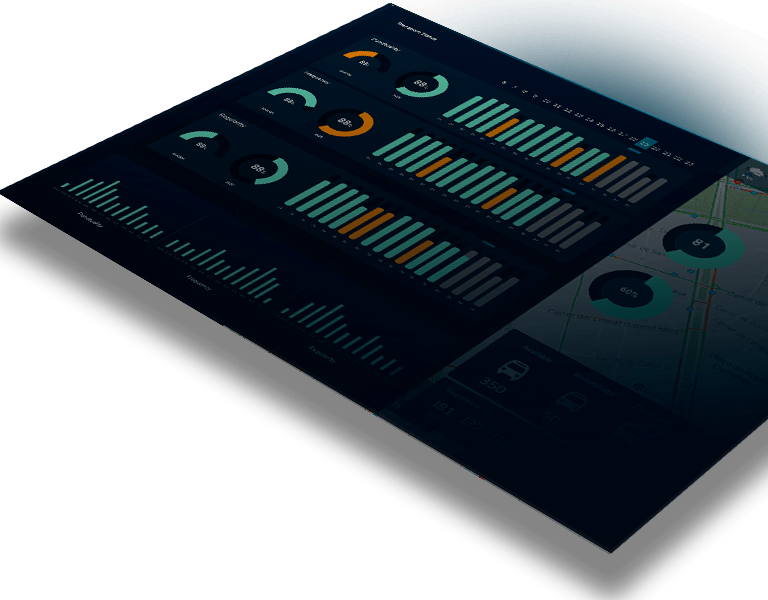
Dashboard that monitors the Traffic Regulation Center of the EMT Operations to work in a more effective and efficient way.
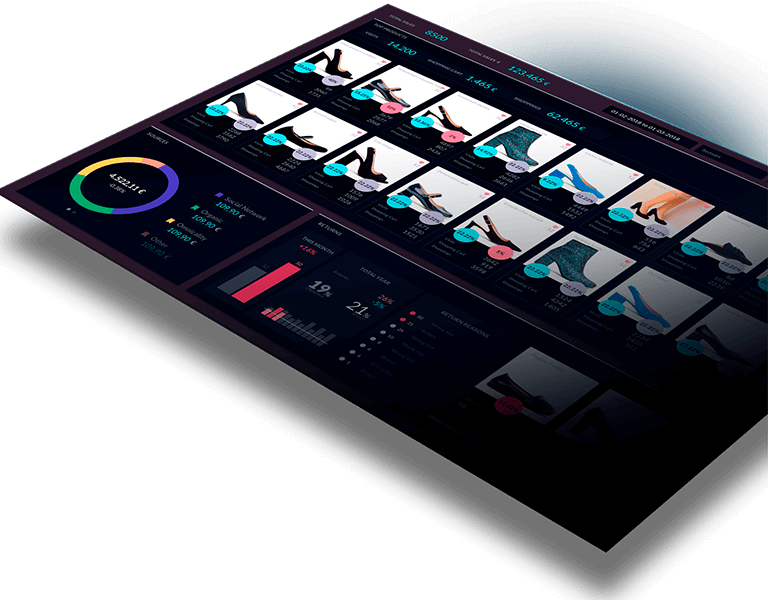
Sales analysis, product comparison, efficiency of advertising campaigns. All in real time
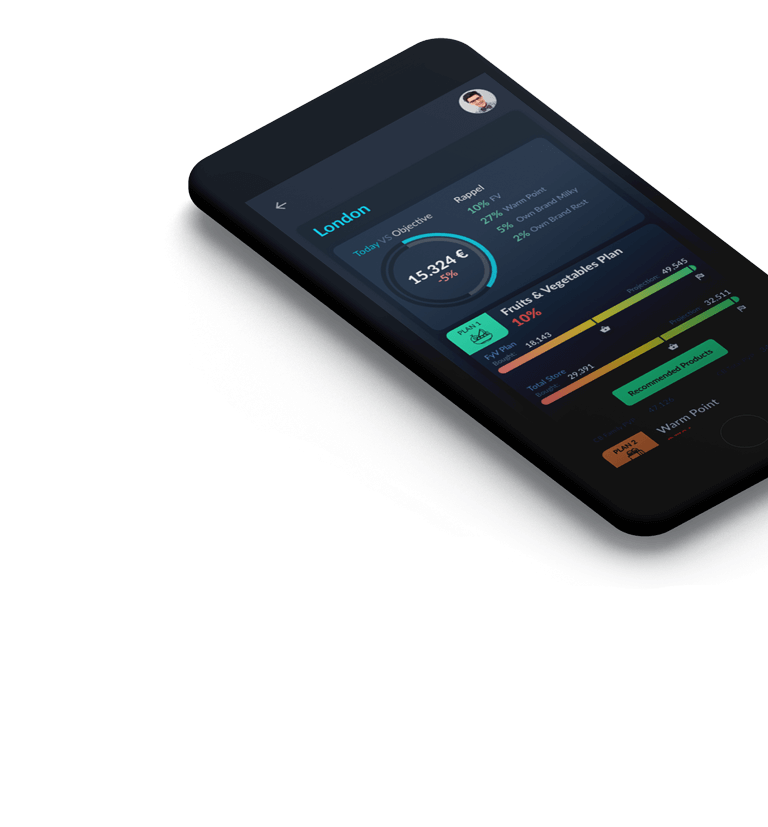
Development of a Sales Force app where in real time they have all the sales information
